History of residential units served by sewers and onsite wastewater systems
by Joe Costa
The Buzzards Bay NEP is working with several groups of investigators to estimate historical land use in the Buzzards Bay watershed. We will make this data available to interested investigators to encourage research on watershed loading and to promote a better understanding of technical issues surrounding estimating non-points sources of pollution to Buzzards Bay embayments.
A key element of any embayment watershed loading analysis is the estimation the number of septic systems in embayment watersheds over time. Calculating the number of septic systems in a watershed is a relatively simple task in Massachusetts because MassGIS has released a Level 3 Assessors Parcels coverage for all municipalities in our region. This parcel data set includes a year built field. Using this coverage is relatively straightforward in unsewered watersheds, and in the simplest approach, the parcel centroid can be used to estimate the assumed placement of a structure, and the number of presumed septic counts over time can be estimated. The Buzzards Bay NEP is actually using a somewhat more complex approach in that we are using a building footprint database, and are using the location of the largest structure on a parcel as a proxy for the location of the presumed septic system. In the example below, we show the number of septic systems over time in the Little Sippewissett watershed. The figure shows counts in the watershed and do not account for groundwater travel lag times.

Residential units served by septic systems in the Little Sippewissett marsh watershed.
In sewered watersheds, the estimation of the number of septic systems is a bit more complicated. To facilitate this analysis, the Buzzards Bay NEP is estimating the approximate sewer connection timeline for the different sewered areas of Buzzards Bay. This is only an approximate method because of how homes with septic systems are connected to sewer lines as sewer networks are expanded. In the idealized scenario, a municipality hires a contractor to lay a sewer pipe down a street, and homeowners are required to connect to it. Typically, most homeowners will connect to these new sewer lines within two years. However, sometimes for financial or other reasons, a homeowner may not connect to a new sewer line. In some instances, perhaps 10% or more may not connect within two years. A few properties may delay connecting for a number of years resulting in enforcement orders issued or leans applied to the property. To definitively identify sewer connection history in any watershed, sewer connection or betterment records must be examined. In some cases these exist only as paper records in some municipalities.
For new construction (subdivisions or single lots) the sewer connection process is more certain. New subdivisions cannot be built or occupancy permits issued unless the structures are connected to the existing sewer system.
By understanding these processes, and in the absence of parcel-specific sewer connection dates, the number of septic systems over time in any watershed can be reasonably estimated using a sewer history map, like the one being developed by the Buzzards Bay NEP (a draft is available on our wastewater page . This sewer history map can be joined to the assessors year built records. In general, structures built after an area is sewered are assumed to be sewered at the time of construction. Preexisting structures are presumed to be sewered at the time the area was sewered in the database. The Buzzards Bay NEP is undertaking such an analysis for both parcels and residential units for different watersheds, and we hope to release this data in October 2015 for use by researchers. In the examples for Onset Bay and Buzzards Bay below, we show both the number of total residential units in the watershed, and the number of residential units served by sewer.

Counts of residential units served by sewers and septic systems in all of Buzzards Bay. These are counts in the watershed and do not account for groundwater travel lag times.

Residential units served by sewers and septic systems in Onset Bay. These are counts in the watershed and do not account for groundwater travel lag times.
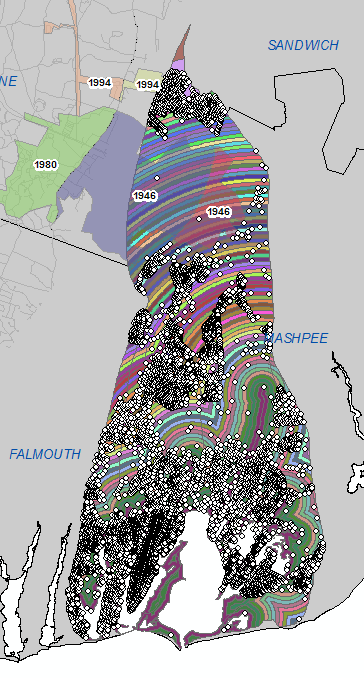
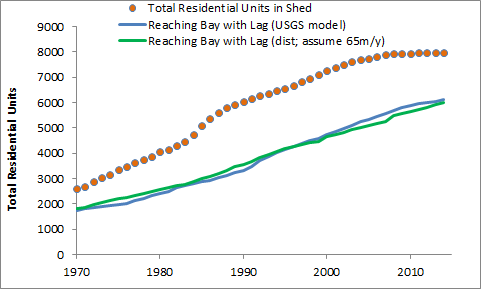
Time Series Analysis: Example for Waquoit Bay with estimated lag time
There is always a lag between discharges to a watershed and loadings discharged in the receiving waters. Ideally, groundwater models can be applied to the kind of data presented here. Where groundwater model data may be unavailable, distance from the coast is sometimes used to approximate travel time if typical ranges of groundwater travel times have been documented.
As illustrated in the figures below, and as included in the spreadsheet at the bottom of this page, we intersected residential unit estimates to 100-meter bands from surface waters (in this case, we included streams to the first major impoundment). In the spreadsheet, we assume that groundwater travels 50 m per year to establish an effective year built from an embayment loading perspective in order to generate the graph below (septic systems discharging to the watershed versus reaching the bay). The spreadsheet contains a tab with array formulas, and another with a pivot table to illustrate how the data can be easily quantified.
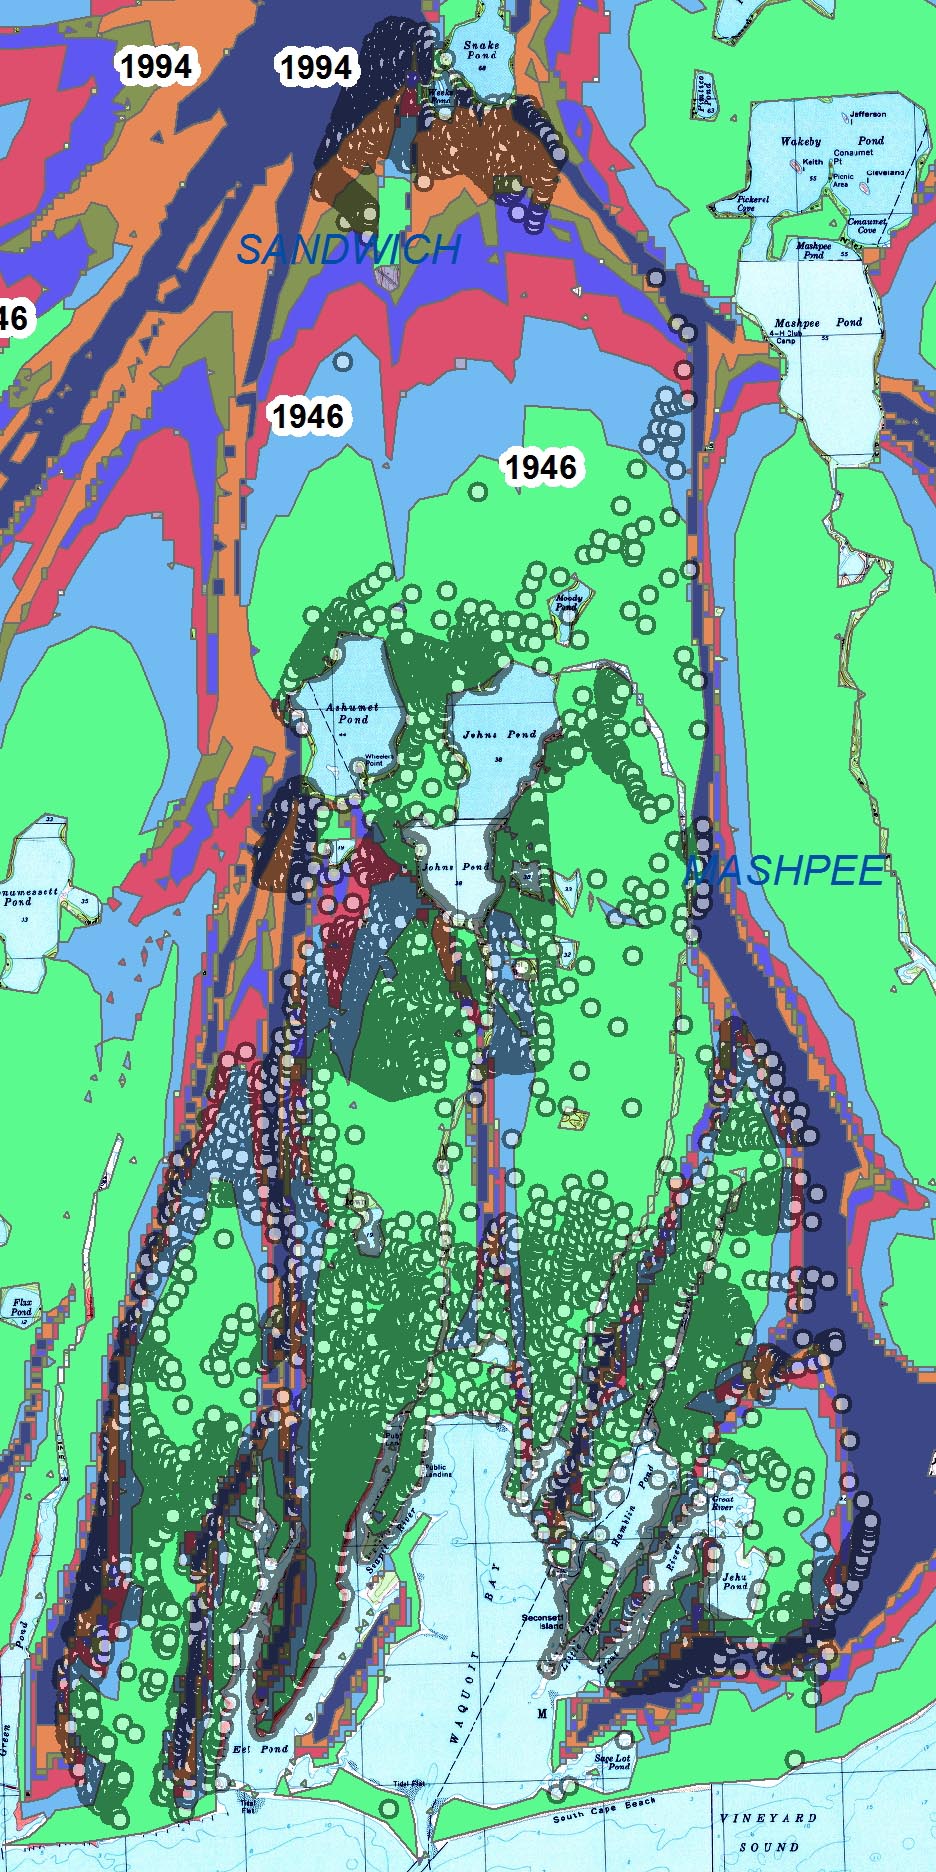
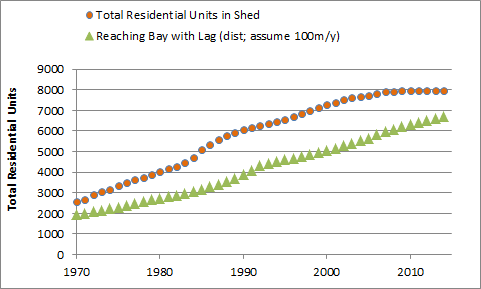
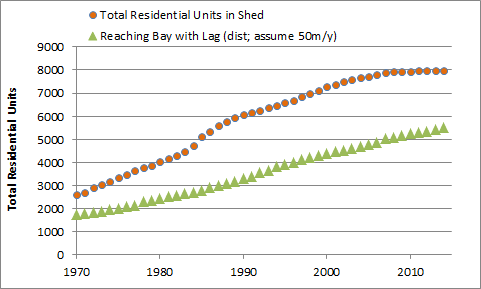
USGS has developed a groundwater travel time model for Cape Cod. The spatial resolution of the model is somewhat coarse, and there are some elements of the model that do not seem realistic (e.g. groundwater travel times greater than 100 years at watershed divides, even when those divides are just a few hundred meters from the coast.) Below is a graph that shows loadings to the watershed versus loading to the bay when transit time lags incorporate the USGS model. (For example, if a structure was in a 20-30 year travel time zone, 25 years were added to the year built for the home. Thus, if it were built in 2000, the nitrogen from its septic system would not be presumed to enter the bay until 2025.) Note the apparent good fit between the USGS model and an assumed average travel time of 65 meters per year (0.6 feet per day) when applied to the distance bands. This result is a function of the distribution of homes in the watershed and the distribution of travel times in the USGS model particular to this watershed. This average travel time may not be applicable to other watersheds or specific areas within this watershed and instead represents a weighted average for all properties in this watershed.
Open this waquoit_parcel_points_assessor2012_9sep2015.xlsx spreadsheet to see the data and how it was analyzed.
Considerations on using these databases
There are a number of limitations and cautions that should be observed when using the Buzzards Bay NEP’s data and the approach described here, and these caveats are noted below.
Year Built
Most assessors databases have assigned a year built value to the primary structure on each parcel. However, it is important to recognize that structures that were demolished and rebuilt, or have undergone appreciable reconstruction, may have had the year built field reset to the date of reconstruction. If using the year built field alone, the preexisting structure will not be counted. The relevance of this error increases the further back into time that the year built database is evaluated. Based on a cursory review of certain watersheds, it appears the year-built information for structures built after 1985 may represent less than 1% of the properties in most watersheds. At selected sites, the proportion of rebuilt properties can be greater. For example, a string of homes along a barrier beach in Mattapoisett existed for decades as mostly summer cottages (with septic systems). Most were destroyed by hurricane Bob and were substantially rebuilt, and now have year builts of 1992 to 1995 within the assessors database.
Incomplete Information on the Sewer History Timeline
Large areas of Dartmouth and the northern portion of New Bedford still need to be validated. The timeline is quite complex, and because there has been so much sewering in the watershed during the past two decades, a more detailed analysis to the parcel level may be required to evaluate the relationship between loadings and water quality.
Discharge Loadings
This fall, the Buzzards Bay NEP will post historical nitrogen loadings from wastewater facilities in Buzzards Bay.
For those evaluating loadings from the OTIS ANG wastewater treatment facility, up until 1995, the discharge was in Falmouth, just north of Rt. 151, in the Coonamessett River valley, mostly within the Green Pond watershed (along Nantucket Sound). The discharge had resulted in the closure of a drinking water well in the Town of Falmouth. In 1995, the infiltration beds were relocated to the Town of Sandwich to an area near the Cape Cod Canal, just within the boundary of the Buzzards Bay watershed. Theoretically, given tidal flow in the canal, about half the load would go to Cape Cod Bay, half the load to Buzzards Bay.
Lag times
The time for a wastewater plume to reach the coast will depend on its distance. It is generally assumed that wastewater travels 1 to 3 feet per day (typically rates are slower inland or closer to watershed divides, and higher near the coast.Thus, a wastewater discharge a few hundred feet from shore could reach the coast in less than a year, whereas a discharge far inland might not reach the coast for decades.
Occupancy rates, vacancies, and seasonal rentals
Just because there are more residential units in a municipality does not mean there are more people living there. Populations change with the local economy, and in recent decades, in many towns, household sizes have declined, and the median age of resident. As shown in the figure to the right, the City of New Bedford generally declined between 1930 and 2010, whereas during the same period, the populations in Buzzards bay towns increased, sometimes dramatically.
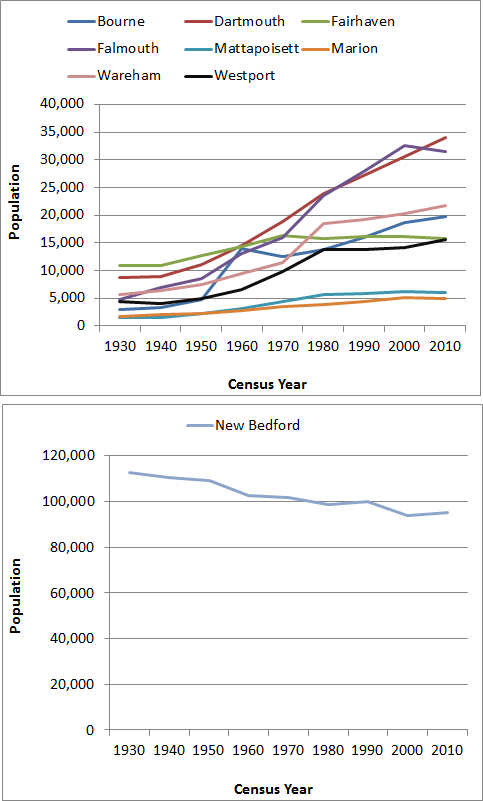
Buzzards Bay municipal populations (year-round) from 1930 to 2010