Parcel Loading Analysis Example for the Wareham River Estuary (PART 1)
[Note: The data presented here is in draft form and may contain errors and is presented for the purpose of illustrating GIS methodologies.]
Parcel level loading analysis requires translating parcel information and other spatial GIS data into quantities that are added into a nitrogen-loading spreadsheet. (Actually, you could do most of the analysis in a GIS environment, but this approach would make it difficult for government officials to validate independently the data, so in this exercise we will import GIS shapefile dbf files into a loading spreadsheet and crunch the data with a combination of pivot tables and array formula). When it comes to estimating watershed nitrogen loading, it is important to recognize that the use of proprietary models are not required if the loading model assumptions (e.g. the loading factors used for different nitrogen sources) are explicitly stated.
In this example we will apply loading coefficients adopted by the Massachusetts Estuary Project (MEP) to GIS data for the Wareham River estuary watershed, and we walk the reader through the process of calculating or deriving the specific parameters that would be entered into the loading spreadsheet. Specifically, the MEP loading methodology requires an estimate of fertilized area (lawns, golf course, agricultural lands), septic system loading, point sources, and impervious area (roof, driveway, and roads), as well as point source discharges and farm animal waste discharges where appropriate, and methods to calculate each of these are described below.
When it comes to analyzing GIS spatial data (wetlands, impervious cover, etc.) and town databases (Assessor’s, water departments, etc), as well as when integrating and joining datasets, there are many possible approaches, techniques, and data processing shortcuts that can be taken depending upon the quality of the datasets and the skill of the analyst processing the data. The methods and approaches described here require intermediate level of proficiency in ArcMAP (ArcView license) and spreadsheet manipulation. In this exercise, the GIS methodology and processing differs in approach from that used by the MEP and some other nitrogen loading methods, but the result is a reliable estimate of each loading source that can be correctly applied to the DEP-MEP adopted loading coefficients.
Key assumptions and variances from the MEP model
In the case of lawns, the MEP loading model assumes 5,000 square feet of lawns for each residence in the watershed. We use that approach in this demonstration, except for properties less than 8,000 square feet. This is because the MEP model may also assume a 1,500 sq. ft driveway and 1,500 sq. ft building footprints (the actual areas may change in some studies), and for very small lot sizes, it would be physically impossible to have a 5,000 sq ft lawn. This is not a trivial issue in this watershed because 18% of units in the Wareham River watershed are on 5,000 square feet or less. In this exercise, for lot size < 8,000 sq ft, lawn size was estimated by the formula lawn size = (lotsize-3,000).
For roof and driveway area, the MEP may assume 1,500 sq. feet of driveway and 1,500 sq. foot of roof for every building in the watershed (in some recent studies, 850 average driveway area may be used, and if building footprints are available, those values may actually be used). This methodology may approximate conditions well in some suburban Cape Cod watersheds, but for older urban watersheds, it underestimates impervious surface area. In 2007, MassGIS released an impervious surface coverage that provides an excellent basis for estimating impervious cover in Buzzards Bay watersheds, and in this demonstration, we will use that coverage. However, one special issue in this data set is that it includes bare devegetated areas such as sand mining areas, sanding areas and cleared areas near cranberry bogs. This means if we use the MassGIS impervious cover, residential and urban areas must be treated differently in the loading spreadsheet (described below).
For golf courses and agricultural lands, in this example we will use MassGIS 2005 land use data, or in the case of cranberry bogs, we will use the Mass DEP wetlands conservancy program coverage (updated for cranberry bogs in 2010 by the BBNEP). On Cape Cod, the MEP has digitized golf roughs, tee areas, and fairways, but the loading rates per unit area are not significant enough to warrant this approach in this example. Similarly, the MEP uses an assumed percent cover for agricultural lands, but the MassGIS agricultural lands acreage is much more accurate for loading purposes. The GIS coverages we create here, because parcel specific data is preserved, any automatically generated value can be overridden.
In many watersheds, septic system discharges to groundwater are the single largest source of nitrogen loading in any watershed. Therefore, one of the most critical steps in any loading analysis is to identify correctly the location of septic systems. This means that not only must you have reasonably good information from towns about sewered and unsewered areas, but in the case of large parcels near subwatershed divides, some attention needs to be given to septic system placement, especially if a parcel is divided among two or more subwatersheds. For this analysis, we will create centroids for all unsplit parcel polygons using a centroid-label function which ensures that centroids are kept in the parcel boundaries. This centroid was assumed location of the septic system and lawn in this analysis. This approach assured that lots with septic systems were not counted within multiple watersheds.
For smaller watersheds on Cape Cod, the MEP linked water use records to each property to account for family size and seasonality of residential use. While this technique has not been applied to larger Buzzards bay watersheds, this separate centroid file can expedite the processing of joint water use data from the centroid point coverage.
For single-family residences on small lots, automatically generated centroids on lots will be acceptable for a large number of lots, any placement errors will cancel out by chance. For larger lots, and for commercial properties, the placement of these centroids could be important, especially if loading is linked either to water use on zoning classification.

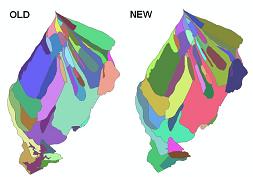
Original and cleaned up and subwatersheds for the Wareham River watershed (colors arbitrary; click map for larger view plotted on a topographic map).

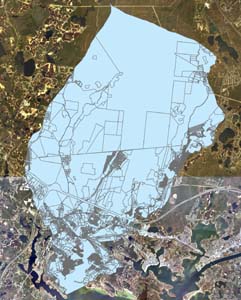
The seamless parcel coverage for Carver, Plymouth, and Wareham was clipped to the entire subwatershed. Click image to see more detailed map or open this Google Earth File of this coverage to see individual parcels: warehamriver-whole-parcels.kmz.Plymouth, Wareham, and Carver parcels were dissolved when adjacent parcels had identical CAMA numbers property ownership (1st combined for Wareham), or common property ownership (all towns) to create a simplified parcel coverage shown below.

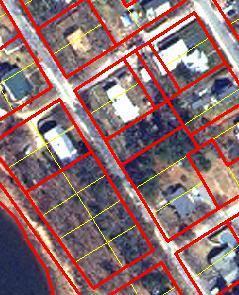
Wareham parcels boundaries were dissolved (yellow lines) by CAMA number under common ownership to create aggregated parcels.Parcels then were identified as being sewered or on septic based on various sources of information. The Google link below only shows dissolved parcel information and wastewater disposal information combined, together with unit numbers labeled.Google Earth File : warehamriver-whole-parcels-ww.kmz (1.7 MB).

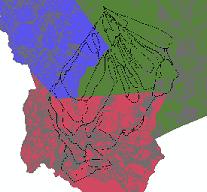
The merged parcels then intersected with minor subwatersheds.
Step-by-Step GIS analysis-conducted with an ArcView 9.3 license
Step 1: Clean up watershed coverages
The Wareham River estuary subwatershed file was derived from a USGS groundwater study for the watershed. This shape file contained overlap and gap slivers which can create immense problems when splitting up parcels and other coverages, and they must be eliminated. These features were cleaned up both manually on the larger problem polygons by using topology editing commands in ArcView, and by eliminating small slivers by using the Integrate command (xy tolerance = 2 meters).
Another nuance to be addressed is that original subwatershed coverage did not match actual coastlines or carve up the estuary in a consistent manner. Because the next step involves creating a seamless parcel coverage of all land and water in the study area, the estuary was subdivided merged into adjoining coastal subwatersheds. Compare the original subwatershed coverage (agawam_subw_0309.zip) to the final subwatershed shapefile (warriv_subwne_041210.zip) (Coarse view is shown in the image to the right).
Step 2: Clean up town parcel coverages
The Wareham River estuary watershed spans the towns of Plymouth, Carver, and Wareham, which meet different levels of accuracy and completeness. For this exercise, we used the MassGIS online version of Plymouth database (Level II, from 2007), a new Carver parcel coverage we received from Carver that dates to 2009 (Level II), and a 2006 Wareham parcel coverage we received from SRPEDD that includes 2005 Assessors data (Level 0, initial cleaning: repair geometry and integrate at 0.2 meter tolerance).
The Wareham parcel coverage, which was Level 0 quality, posed many problems. One large issue was that it did not contain polygons for non assessors parcels. Furthermore streets not clipped to a coastline. To address this problem, first we clipped the parcel coverage to the Townsurveypoly shapefile which has a detailed coastline based on recent aerial photographs. Technically this was not essential, but because the parcel coverage was sufficiently in agreement with aerial photography, this step eliminated fictitious land near the coast (that may have eroded away), and avoids certain complications in preparing maps and calculating areas in later steps. Next this clipped parcel coverage was unioned with the shapefile bounds_poly.shp, which is the complete MassGIS town boundary areas, including coastal waters. This union created a large multipart polygon that included roads, ponds, coastal waters, and other features, including some fill slivers near the municipal boundaries. We also had to repair edge problems between the towns of Carver and Plymouth, because the MassGIS Townsurvey_bounds file for the two towns had some gaps between. The three-town file coverage we created (townsurvey_2towns_wbounds.shp) was used to file in any gaps in individual town parcel data. (All data sets were cleaned up with ArcMap shapefile Repair and Integrate (0.1 or 0.2 meters).
We could have cleaned the coverage up further by breaking off the bay from roads, etc, but this was not necessary because we used certain MassGIS coverage to calculate surface water areas, impervious areas, and agricultural areas rather than rely upon the imperfect Wareham parcel data set, and because in all three towns certain features cannot be calculated by parcel area (for example road area is considerably less than road parcel layout area).
This new Wareham parcel coverage was then merged with the Carver and Plymouth parcel coverages after ensuring that consistent field names were used in the three data sets. An image of this coverage is in the right panel, as well as a Google Earth file (warehamriver-whole-parcels-ww.kmz).
Finally, the parcel coverage includes adjacent lots under single ownership that were combined to make a single buildable lot. Fortunately, the Wareham Assessor’s office assigns a single CAMA number to most of these common ownership parcels. This parcels were merged by using the ArcMap dissolve for parcels with identical CAMA numbers and same owner (exclusive of blank owner records, and multipart polygons were not allowed). A similar problem was resolved in Plymouth, where adjoining contiguous parcels with the same property address successfully captured these combined lots (this merged undeveloped contiguous lots in common ownership, but this result did not affect the loading analysis). This problem was not evident in that portion of Carver in the Wareham River watershed. The final result was a file called 3town_parcels_final.zip. This file was then clipped by a merged subwatershed file to create the coverage 3town_parcels_1shed_final.zip.
Step 3: Merge three town parcel coverages
When the three cleaned-up town files were combined into a single coverage, a new field was added called PAR_ID_WHL with each parcel’s centroid id (xcord_ycord). The coverage was then intersected with the subwatershed file, and new a similar new centroid id field called PAR_ID_SPL was created for all polygons. Split parcels were easy to identify in this way because PAR_ID_WHL <> PAR_ID_SPL on split polygons. These two parcel ids will facilitate data management, analysis, and reaggregation in later steps. Next we cut up the parcels a second time with subwatershed boundaries, and created yet one more centroid identification field called PAR_ID_SUB. This new file is called shed_parcels_subs.zip.
At this point, our GIS work on the parcel fabric is complete. We have all the watershed parcels (including non-Assessor’s parcels we had to create) available to intersect any spatial coverage (land use; see steps 4 and 5) and “point” coverages (lawns, septic systems, and where appropriate, discharge pipes; see step 6).
Step 4: Add Key Land Use Areas
For non-cranberry agriculture, MassGIS 2005 Land Use categories of freshwater, estuary (add to the data set), cropland, pasture, orchard, and golf course coverages (dissolved) were intersected with the new subwatershed split parcel coverage from step 3. For cranberry bog area, we used this modified and updated (for the BB watershed) cranberry bog production area shapefile (features dissolved first) and intersected it with our watershed-parcel coverage. The areas of each of all these coverages were joined to the specific parcel in the watershed (it turns out there are no golf courses or cropland, other than cranberry bogs, in the watershed).
| Land Use Category | Acres | Comments |
| Freshwater | 1764 | |
| Cranberry Bog | Used MassGIS DEP wetland coverage (updated), not land use. These polygon areas demarcate just the vegetated (=fertilized areas), and some minor bare areas (berms). | |
| Orchard | 2 | |
| Pasture | 236 | |
| Other Cropland | 0 | |
| Impervious- Bare (non bog) | 2310 | Intersection of MassGIS impervious with non-developed MassGIS coverages such as mining, beaches, pasture, transmission lines, etc., EXCEPT any areas already included in the Cranberry production areas above (to avoid double counting any disturbed areas). |
| Impervious developed | 1637 | This category included any impervious falling in the developed-land Mass GIS Land Use categories, including transportation, commercial, industrial, and residential. Any impervious coverage not in the cranberry bog or impervious-bare category fell into to this category. |
Continue to Wareham River Watershed Loading Analysis Demo, PART 2