by Dr. Joe Costa
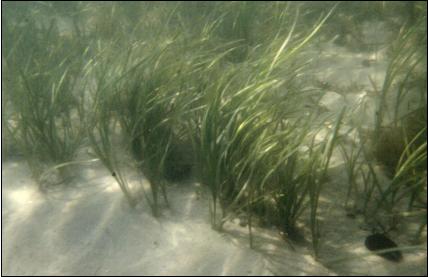
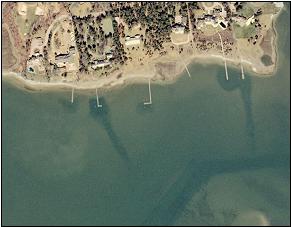
Eelgrass in shallow waters at Uncatena Island (near Naushon Island in Buzzards Bay). Photo credit Joe Costa
Eelgrass in the Buzzards Bay Environment
Eelgrass (Zostera marina L.) is a sub-tidal marine angiosperm, or “seagrass,” that grows in temperate waters, often forming extensive underwater meadows. Eelgrass beds are highly productive communities, and are ecologically important because they act as a nursery, habitat, and feeding ground for many fish, waterfowl, and invertebrates. As such, eelgrass beds, as well as other seagrasses, often have become the center of resource management initiatives to protect them.
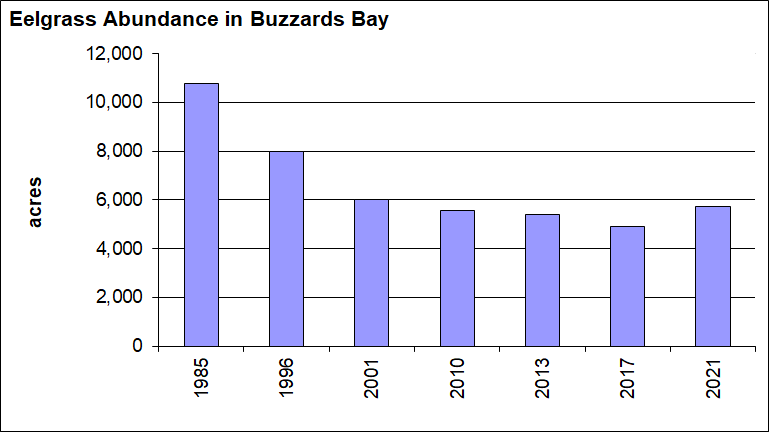
In Buzzards Bay, eelgrass is an important habitat, and today eelgrass beds are more extensive than salt marshes. However, because eelgrass beds grow underwater, this habitat generally goes unnoticed except by boaters, shellfisherman and divers. The widespread distribution of eelgrass in Buzzards Bay, and its sensitivity to pollution also makes it an ideal indicator species for changes in water quality. For these reasons, the Buzzards Bay National Estuary Program funded a study of eelgrass distribution in Buzzards Bay (Costa, 1988a), which was based on historical aerial photographs, field surveys, and sediment cores. The Costa survey documented both existing distribution and historical trends of eelgrass abundance in Buzzards Bay. This work incorporated many elements of Costa’s Ph.D. thesis (Costa, 1998b), which can be downloaded at the bottom of this page.
In 1991, after characterizing water quality and habitat problems of Buzzards Bay, the Buzzards Bay National Estuary Program developed a Comprehensive Conservation and Management Plan that included strategies to protect and restore wetlands, habitat, and water quality and living resources in Buzzards Bay. In this management plan, the loss of eelgrass, due to excessive discharge of nitrogen from human sources associated with development, and other human activities, was identified as a priority concern that required management action.
Because eelgrass has been recognized as a sensitive indicator of nitrogen loadings and because the distribution and abundance of eelgrass beds can be easily documented with aerial photographs, it is an ideal habitat to track to monitor overall ecosystem health. In the CCMP monitoring plan, it was recommended that this eelgrass habitat be mapped every three to five years to document human impacts and the success of management action to reduce nitrogen inputs and other water quality impacts (Buzzards Bay NEP, 1991, Volume 3). It was expected that this eelgrass monitoring would be part of a strategy to document specific ecosystem changes to changes in nitrogen loading, and to help establish embayment-specific nitrogen loading targets or annual critical loads. Because historical aerial photographs of this region span 65 years, these older photographs were recognized as an important tool for documenting historical changes, and identifying these critical limits.
In the late 1990s, the Massachusetts Department of Environmental Protection conducted a new survey of eelgrass in Buzzards Bay based on a May 9, 1996 aerial survey, and summertime 1996 surveys. In 2005, DEP made available its maps from a survey based on a 2001 aerial survey, and future surveys will be undertaken.
The Buzzards Bay Setting
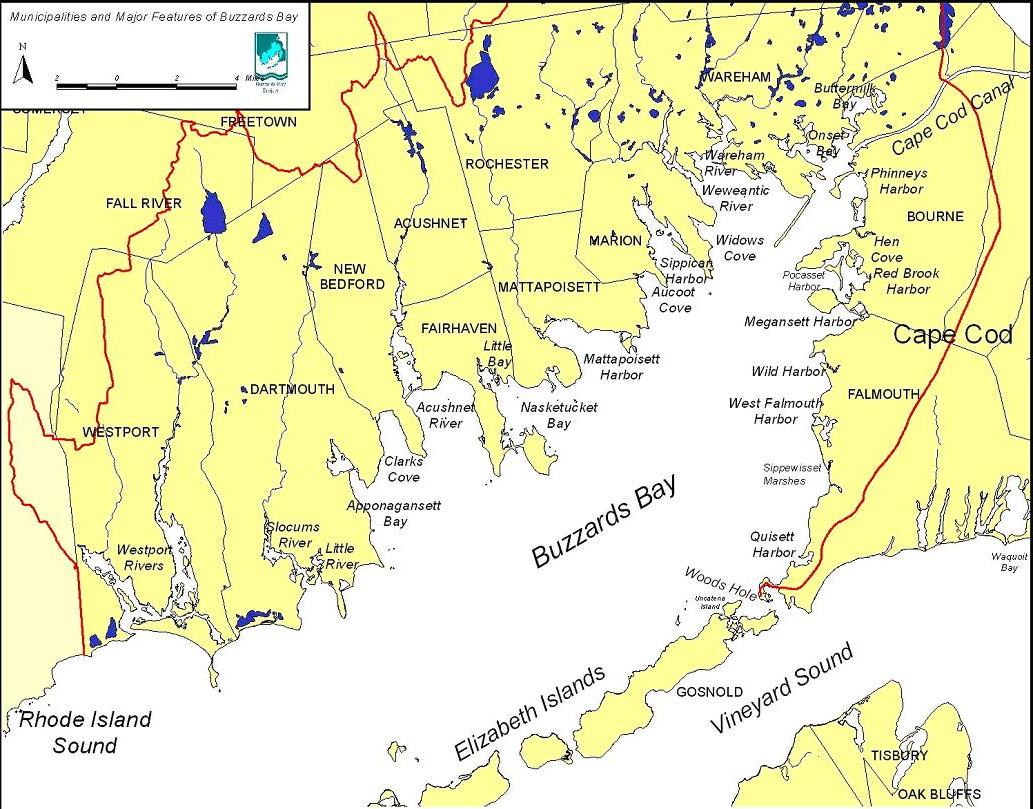
Buzzards Bay is a semi-enclosed embayment located along the southeastern coast of Massachusetts. Cape Cod and the southern edge by the Elizabeth Islands form the eastern edge of the Bay. The Bay is 28 miles long, has a mean width of 9 miles, covers 235 square miles, and has a mean depth of approximately 36 feet. Buzzards Bay is moderately well flushed and exchanges water with Rhode Island Sound to the southwest, with Vineyard Sound through passages in the Elizabeth Islands, and with Massachusetts Bay through the Cape Cod Canal at its northern end. Glaciers that receded about 12,000 years ago formed Buzzards Bay. These glaciers formed the complex network of shallow embayments, drowned river valleys, and estuaries that now make up Buzzards Bay.
General Biology of Eelgrass
Zostera marina L., or eelgrass, is a subtidal marine flowering vascular plant (angiosperm), with all stages of the life cycle occurring underwater, including flowering, pollination, and seed germination. Eelgrass and other seagrasses are often referred to as “Submerged Aquatic Vegetation” or SAV. This distinguishes them from algae, which are not classified as “plants” by biologists (rather they are often placed in the kingdom Protista), and distinguishes them from the “emergent” saltwater plants found in salt marshes. In addition to the term SAV, some coastal managers use the term SRV or submerged rooted vegetation. This term probably arose to avoid confusion because non-scientists considered both seagrasses and algae as “plants” or “vegetation,” and did not realized the term SAV excluded algae.
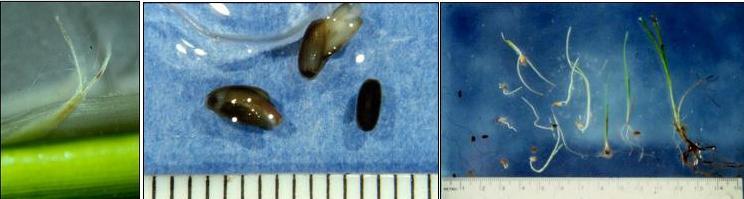
Left: Eelgrass female flower with filamentous pollen attached to stigma. Middle: Eelgrass seeds germinating (scale in mm). Right: Seeds germinating and seedlings (scale in centimeters). Photo credit: Joe Costa.
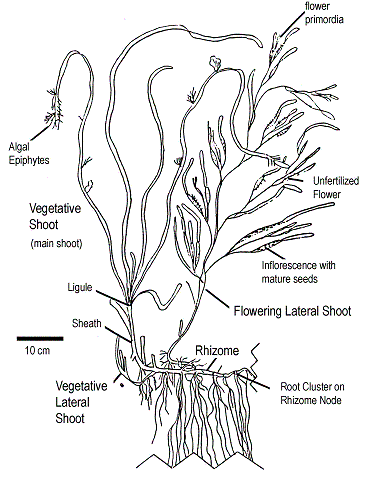
Eelgrass is an herbaceous monocot composed of 3-7 strap-like leaves, bound together in a sheath attached to an underground rhizome. Attached to nodes on the rhizome are clusters of roots that may penetrate sediments 50 cm or more. The plant grows via a basal meristem within the sheath from which emanates new leaves, new rhizome segments, as well as by lateral shoots. The leaves are less than 1 cm wide and 20 – 160 cm long. Plants growing in shallow wave swept bottoms tend to have short narrow leaves with dense root masses, whereas plants growing in deeper water have broader longer leaves with a greater proportion of biomass above ground.
Ecological Value of Eelgrass
Eelgrass beds are highly productive communities that support a diverse assemblage of animals and long recognized as important in coastal food webs. Eelgrass beds act as a refuge, feeding ground, or habitat to many animals, the loss of eelgrass can result in profound shifts in fauna, including commercial and recreational species. For example, in Waquoit Bay, a Cape Cod lagoon, decline in the catch of the bay scallop coincided with eelgrass declines. The collapse of scallop populations in Waquoit Bay probably occurred because eelgrass leaves are important settlement substrates for scallop spat in these kinds of muddy bays.
Eelgrass Colonization
Eelgrass expands by both vegetative growth — the creeping extension of new shoots from the base of the plant, and sexual reproduction or seed production. Bare areas not adjacent to existing eelgrass beds are colonized by new seedlings since uprooted plants are positively buoyant and tend to be washed ashore. Mature fruits release seeds in late summer, and these are thought to be dispersed via currents, uprooted or broken stems, and even air bubbles. Costa found that living seeds declined exponentially from flowering beds. Germination of the seeds may commence in later fall, winter, or the following spring. It is not believed that seeds survive more than one growing season.
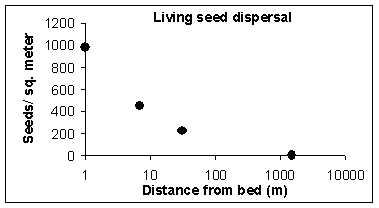
Density of living seeds in surface sediments with distance from a surviving refuge bed in Waquoit Bay in Falmouth (from Costa, 1988b).
Eelgrass Transplantation
Eelgrass can be transplanted by a variety of techniques to help eelgrass recolonize in areas where it has been lost. Recolonization can be promoted by dispersal of seeds. Attempts to colonize an area should be carefully evaluated to determine if the site is worth the effort. As a rule, if eelgrass is absent from an area, there is a good reason why it is not there. This is particularly true if there are nearby beds that can provide seed stock. If the absence is caused by poor water quality or water transparency, eelgrass planting attempts will likely fail unless conditions have improved. For example The Buzzards Bay NEP endorsed the transplantation of eelgrass in New Bedford harbor because of improvement in water quality in the estuary, and because the site was geographically isolated from beds in the outer harbor because of the hurricane barrier.
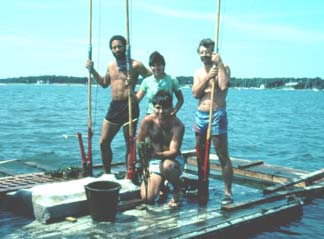
Dr. Joe Costa and crew transplanting plugs of eelgrass in peat fiber pots into a recently dredged channel in East Bay, Osterville, MA as per a DEP superceding order of conditions in the mid 1980s.
Factors Controlling Eelgrass distribution
Eelgrass may be removed from an area by natural and human disturbances of varying scale and frequency. Natural disturbances include disease, catastrophic storms, periodic storms, sediment transport, ice damage, and grazing pressures. Human disturbances include physical disturbances (dredging, groin construction, shellfishing, propeller damage), toxic pollution, and degradation of water transparency from nutrient enrichment, topsoil runoff, and activities that resuspend sediments. It is likely that eelgrass will colonize any of these devegetated areas or new habitat if conditions become conducive to lateral growth of vegetative shoots or germination and survival of seedlings. Eelgrass will not return if the disturbance is accompanied by a permanent loss in water quality or transparency.
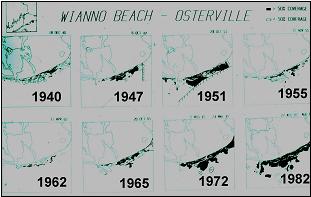
Fluctuations of eelgrass off a Cape Cod dynamic shoreline (Wianno Beach), largely the result of storms.
In southern New England, eelgrass grows to a depth of 1 m MLW or less in bays with poor water quality, but may grow as deep as 12 m MLW in clear offshore waters (Costa, 1988a). Declines are most dramatic when a large portion of eelgrass cover in an embayment is near the lower limit of depth distribution. For example, in both Apponagansett Bay and Waquoit Bay–two uniformly shallow embayments in southeastern Massachusetts with mean depths of 1.5 to 2 m–once had extensive eelgrass populations whose maximum depth of growth coincided with the mean depth of the bays. Both embayments showed a dramatic loss in eelgrass cover in response to water quality declines (Costa, 1988a; Waquoit Bay in Fig. 3). In these kinds of embayments, a decrease of photic zone penetration by even 30 cm will result in a substantial loss of eelgrass habitat area.
The Eelgrass Wasting Disease of 1931-1932
The most profound natural disturbance affecting eelgrass abundance ever documented was the wasting disease of 1931-32 that decimated 90% of the eelgrass in the North Atlantic, including Massachusetts. Any discussion of historical trends and abundance of eelgrass beds in Buzzards Bay must consider the effects of this disturbance, since many areas took more than 40 years to recover. In most bays, the greatest expansion occurred between the mid 1950s and late 1960s. Some scientists have speculated that there are small scale occurrences of wasting disease from time to time in some bays.
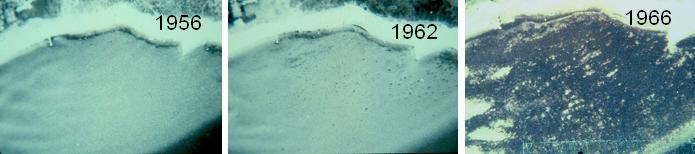
This area offshore of Great Neck in Wareham, MA did not recover from the wasting disease until the 1960s. Notice in the 1962 photograph the tiny circular patches of eelgrass that began to colonize the area from seed from eelgrass beds offshore and adjoining areas.
Human impacts on eelgrass distribution
Many physical and water quality impacts from human activity may affect eelgrass abundance and distribution, and eelgrass is often considered a sentinel species for evaluating ecosystem health. The two principal human disturbances affecting eelgrass growth is declining water quality and physical disturbance.
Nitrogen Loading Impacts
In coastal marine environments, biologically available nitrogen tends to be in short supply, and is the nutrient that typically limits the growth of algae. Consequently, the addition of excessive amounts of nitrogen to coastal waters from anthropogenic sources — often referred to as “nitrogen loading”, “nitrogen enrichment”, or “coastal eutrophication” — results in conspicuous increases in the growth and abundance of algae. This increase in algal production causes, either indirectly or directly, most of the adverse changes in coastal ecosystems attributed to nitrogen enrichment. The response of coastal ecosystems to nitrogen inputs is complex, varied, and gradual, and presents a significant challenge to environmental scientists and regulators trying to manage and characterize the effects of nitrogen loading. This complex response, coupled with the fact added nitrogen is bioactive and does not remain in the water column; no one ecological indicator is satisfactory for quantifying the impacts of nitrogen in coastal ecosystems.
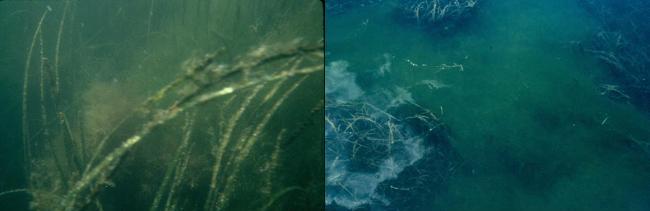
In eutrophic (nitrogen enriched) waters, eelgrass is increasingly covered by epiphytic algae (left: brown, felt-like material on leaves) and smothered by drift algae (right). Photo credit: Joe Costa.
There is ample evidence however, demonstrating that the abundance of submerged angiosperms in freshwater, estuarine, and marine waters (generally referred to as submerged aquatic vegetation or SAV), decline in response to excessive inputs of nutrients. Thus, in shallow temperate marine waters, eelgrass has proven to be a keystone indicator for assessing nitrogen loading. Shifts in marine benthic communities in response to eutrophication, however, are often a gradual, sometimes spanning decades, and may also coincide with other cumulative impacts from years of development and water related human activities such as boating and shellfishing which also disturb habitat and decrease water transparency.
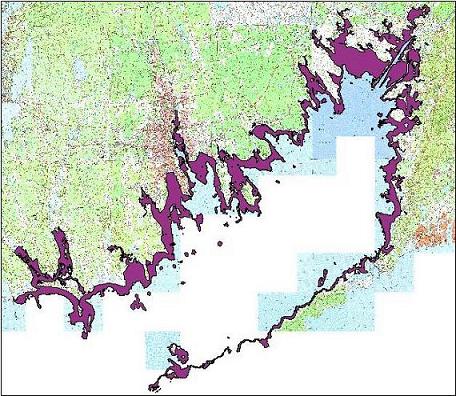
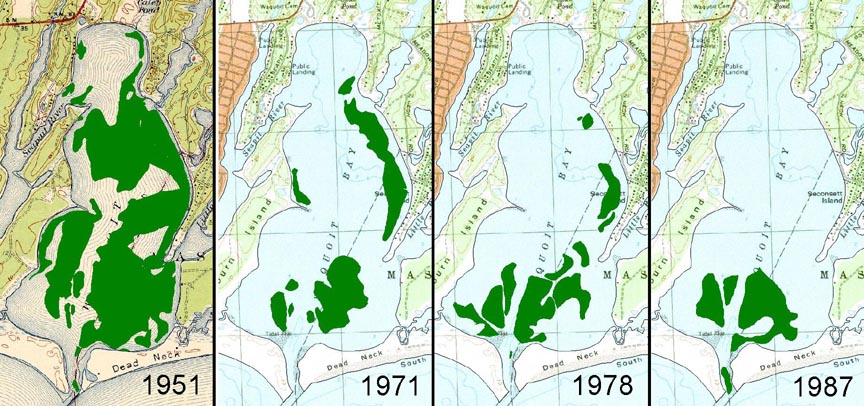 Eelgrass loss displayed on quads.
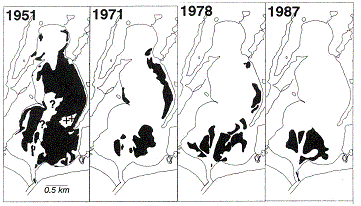
The loss of eelgrass in Waquoit Bay coincided with increased development. Nearly all eelgrass was lost by the mid 1990s. Figures from Costa, et al. 1992 [400 kb pdf].
The primary mechanisms for the loss of eelgrass in marine ecosystems in response to nitrogen loading are shading (specifically the loss of photosynthetically active radiation wavelengths) by algae. Eelgrass obtains nitrogen principally from its roots, but can absorb some nitrogen through its leaves. However, light is most often considered a limiting growth factor, rather than nitrogen in most marine environments. In contrast, marine algae are highly responsive to anthropogenic nitrogen inputs, and increase greatly in biomass and production to nitrogen loading. In eutrophic coastal embayments, algae in the water column (phytoplankton), growing on surfaces (periphyton) and benthic attached and unattached (“drift”) algae all greatly increase in biomass within the photic zone. Cumulatively these algae decreased water transparency and shade eelgrass beds, causing the death of existing plants, and preventing the recruitment of new seedlings.
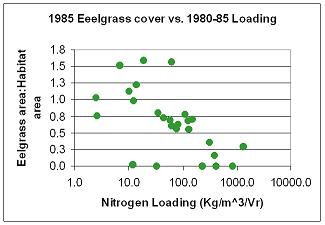
Correlation between eelgrass cover and nitrogen loading in Buzzards Bay embayments. From BBP technical report.
The common pattern for eelgrass loss in response to nitrogen loading is that the depth to which the vegetation grows decreases, and disappears first in the most enriched areas of the bay (typically in the upper estuary) and along the deeper edges of beds. Such a pattern of eelgrass loss can help distinguish eelgrass loss due to physical disturbance or disease. Knowing loading rates and documenting other nitrogen loading impacts in coastal waters can also identify which eelgrass bed losses are due to eutrophication. The major sources of nitrogen to Buzzards Bay NEP embayments have been documented by the Buzzards Bay NEP and are principally from sewage disposal (either onsite system or public sewage treatment facilities) and lawn and agricultural fertilizer. Atmospheric inputs, farm animal wastes, and stormwater are often important contributors from some drainage basins. These high nitrogen loadings reduce the Bay’s water quality, which is reflected by turbid waters, blooms of algae, low levels of dissolved oxygen, and a reduction in the area of eelgrass beds and shellfish habitat which has been well documented by the Buzzards Bay Coalition citizen’s water quality monitoring program.
Sediment resuspension from boats and other activities
Boats with inboard and outboard motors, jet skis, and similar activity can cause considerable resuspension of sediments which may worsen water clarity, and cover eelgrass leaves to the extent that the plants are shaded and begin to die off and disappear from portions of embayments. This may have contributed to eelgrass in some areas in Buzzards Bay like Apponagansett Bay in Dartmouth.
Channels dredged to docks in a Cape Cod embayment. Eelgrass was once prevalent here. The loss was due largely to coastal eutrophication, with sediment resuspension from boating contributing to the loss.

Eelgrass off West Island, Fairhaven in the 1950s.
In Bourne, hydraulic fishing for shellfish, sometimes referred to as “jet-clamming” is allowed, and was particularly prevalent in the 1980s and 1990s. During the 1980s in Little Buttermilk Bay, plumes of sediments were observed from this activity, and considerable rafts of dislodged eelgrass from this activity. Some residents also asserted that this activity was causing erosion of shorelines in some areas, and filling of channels with fine materials.
Eelgrass Maps and Eelgrass Mapping
Since the 1980s, scientists have routinely used vertical aerial photographs to map current and historical distributions of eelgrass. These photographs may have been taken for documenting land-based features, but some older surveys, and some newer ones were taken to maximize visibility of subtidal features. In Buzzards Bay, aerial photographs were used to map eelgrass in Buzzards Bay in the 1980s, and by DEP in 1995 and 2001. Both Costa and DEP used field verification with boats, and Costa used diving (skin or SCUBA) for his eelgrass maps as well. DEP’s 2001 aerial survey was validated with field work in 2001 and 2002. Because it is impossible to verify every eelgrass bed mapped, most field surveys might validate 5 to 10% of the beds, and often focus on features that may be difficult to interpret.
In 2006, DEP and MassGIS released updated maps of eelgrass cover in Buzzards Bay that combined data in the 2001 and 1994 surveys. Information on this program and updated maps are available at:
DEP Eelgrass interactive maps.
Mass GIS eelgrass meta data and download.
Costa Thesis Eelgrass GIS Data
Mapping eelgrass is based on experience, field information when available, and often best professional judgment. There are a variety of techniques, tricks, and useful strategies that are used to map subtidal features, like eelgrass beds, and these are discussed on our eelgrass aerial photograph interpretation page.
Hypothetical Eelgrass Distribution During the Colonial Period
For the 2003 State of Buzzards Bay Conference, the Buzzards Bay NEP estimated eelgrass cover prior to European settlement in the watershed. This was a speculative exercise, but worthwhile in understanding the potential eelgrass distribution in Buzzards Bay without human impacts such as nitrogen loading, increased water turbidity associated with urban runoff, resuspension of sediments from boat traffic. Because eelgrass is largely dependent upon water transparency, and because areas exists in the such harbors in the Elizabeth Islands, and Nearby Martha’s Vineyard and Cape Cod embayments that illustrate the depth that eelgrass may grow with relatively low nitrogen loading rates. That is, certain assumptions can be made about water quality based on existing eelgrass depth distribution on less developed nearby Islands, and assumptions about water quality and transparency. Based on these assumptions, historical eelgrass habitat in Buzzards Bay can be postulated. Such hypotheses can even be tested because Costa (1988, 1989) and others have shown that the remains of eelgrass seed coats (tests) are a valuable biostratigraphical marker that remain in the sediments of many bays and harbors which can be documented in sediment cores.
For the estimation of eelgrass cover in 1600, the following two assumptions were made. First, eelgrass grew to 12 ft. MLW in upper Buzzards Bay, down to 20 feet MLW in lower Buzzards Bay, and second, half of the area between MLW and these boundaries were assumed to actually have eelgrass.
Hypothetical eelgrass cover circa 1600. From Costa 2003 State of Buzzards Bay presentation.
1980s vs. 1990s Changes in Distribution
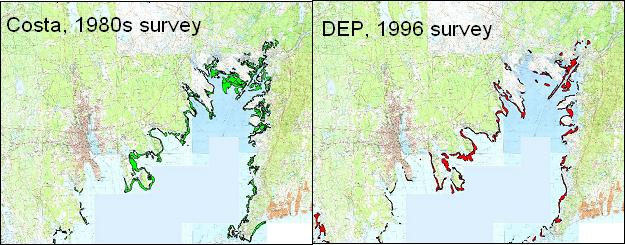
Comparison between the Costa 1980s and DEP’s 1996 mapped distribution of eelgrass.
More maps of historical changes maps on our Eelgrass Historical Changes page.
Historical Analysis of Eelgrass in Buzzards Bay
Draft figure from an upcoming report on a reanalysis of eelgrass in Buzzards Bay.
To expand the assessment of historic and current trends of eelgrass cover, the Buzzards Bay NEP has begun georeferencing and enhancing historic and recent aerial imagery of Buzzards Bay. Included in this effort, we have scanned in detail for the first time, photos from Costa thesis aerial archive, as well as downloaded new and archival photographs from various sources. Using ArcGIS 9.3, images were easily imported and georeferenced generally to within less than 10 ft of current MassGIS ortho base maps. Images were typically enhanced within ArcGIS by stretching raster histograms and changing brightness and contrast. This ability to enhance aerial images enabled visualization of deeper beds and deep edge boundary locations that were impossible to evaluate using tracing and transfer techniques common a decade ago. Bed boundaries were “heads up” digitized in the GIS software with the imagery magnified to capture eelgrass habitat boundaries and bare patches within beds, often with a point spacing less than 10 meters. This approach enabled us to create eelgrass habitat maps with a high degree of precision to the imported base maps. Go to our Historical Changes of Eelgrass in Buzzards Bay to see some maps and summary information from the report.
Town Maps
These are 150-350 kb jpgs.
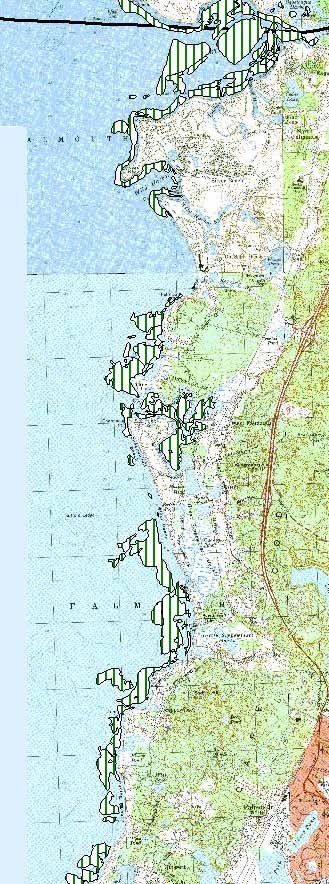
Marion 1980s eelgrass distribution
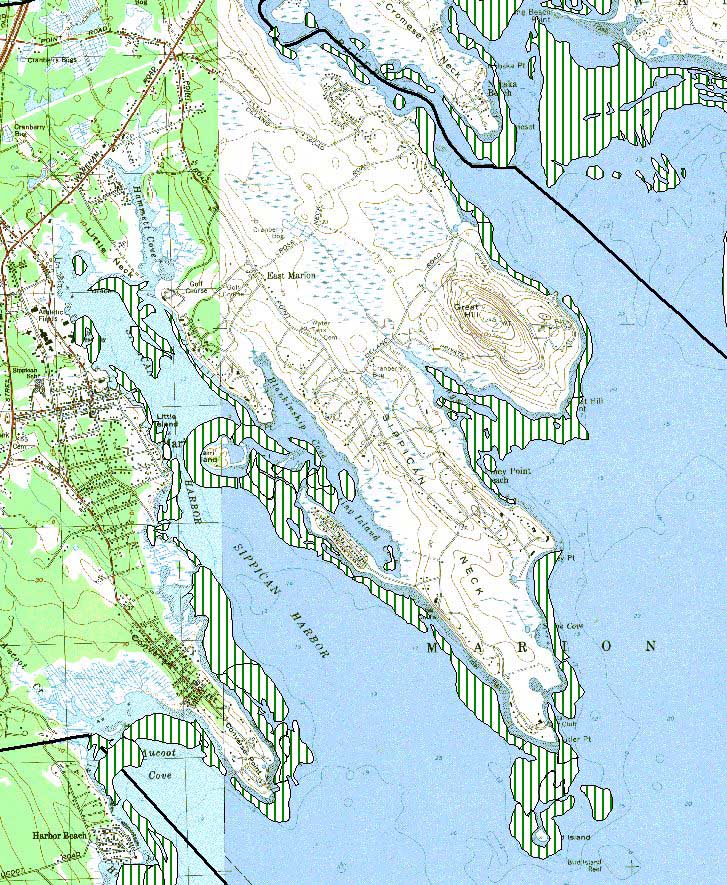
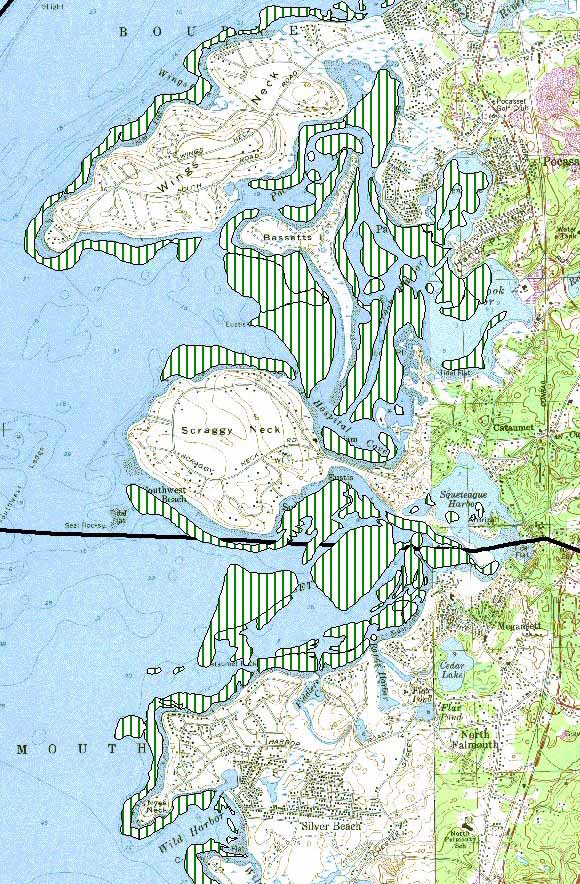
Bourne 1980s eelgrass distribution
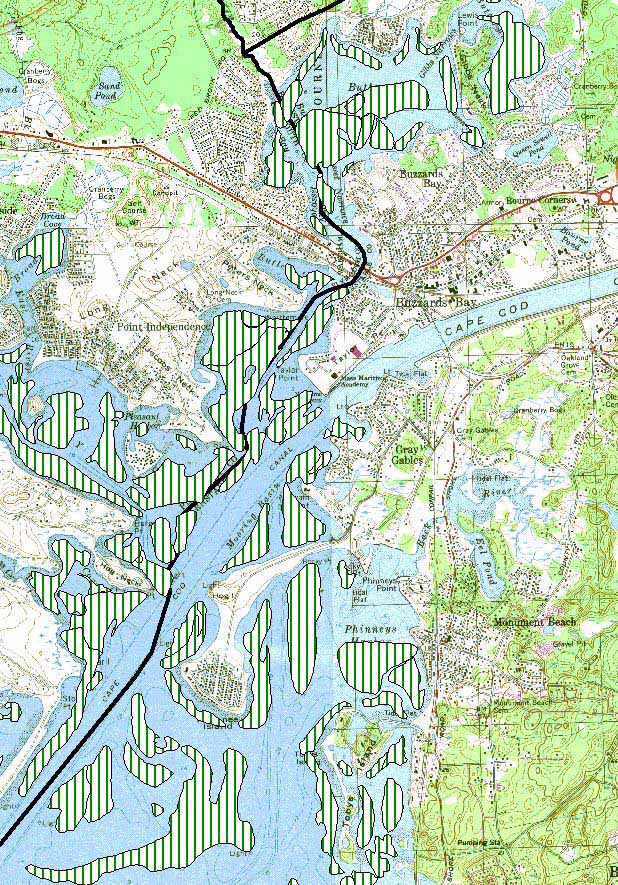
Wareham 1980s eelgrass distribution
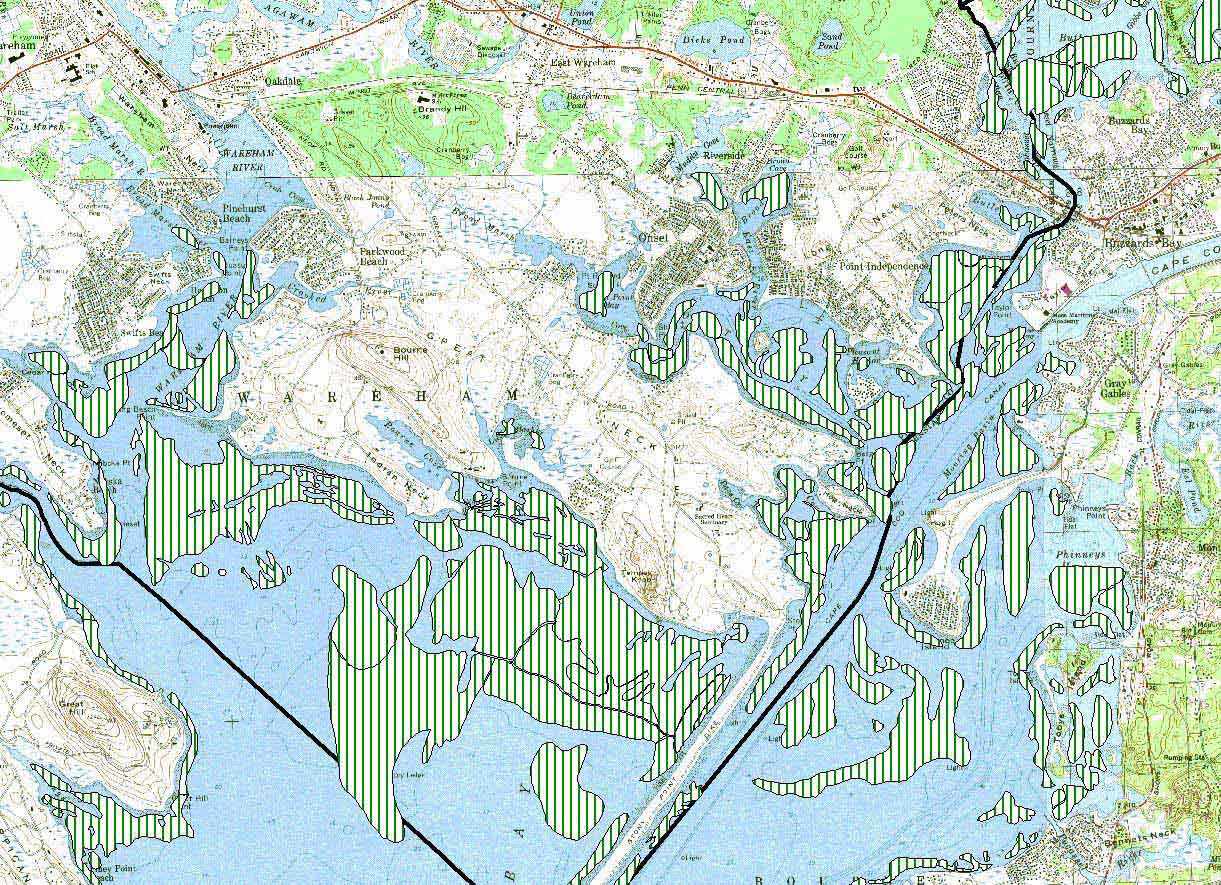
Fairhaven 1980s eelgrass distribution
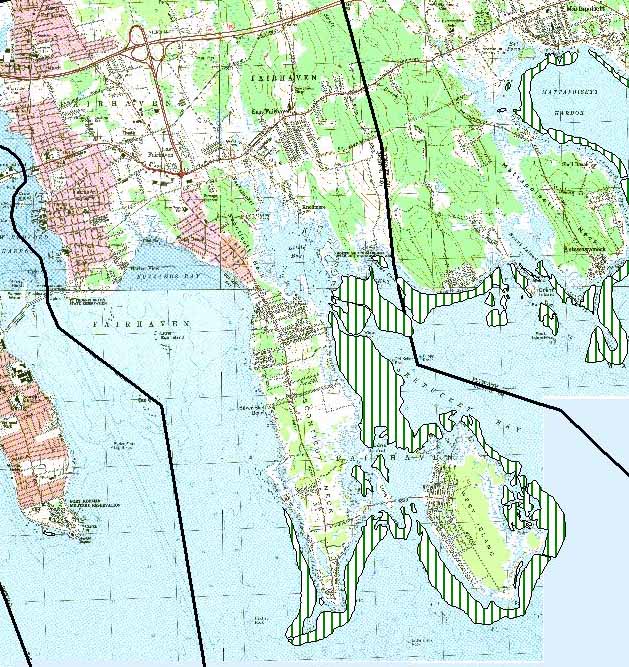
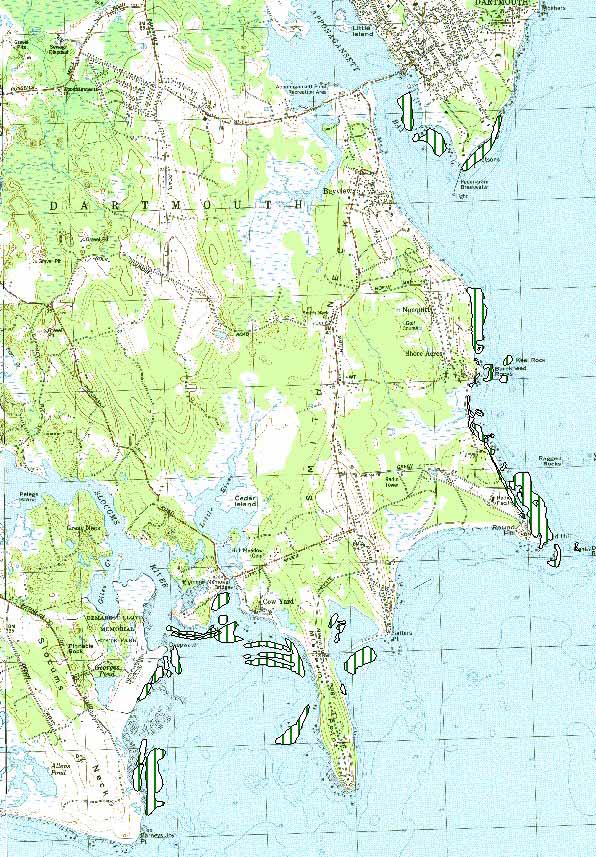
Dartmouth 1980s eelgrass distribution
North and West Falmouth 1980s eelgrass distribution
Bourne – Falmouth 1980s eelgrass distribution
Selected Reports and Correspondence
1988 Costa Eelgrass Thesis
Costa Thesis Eelgrass GIS Data
Reference: Costa, J. E. 1988b. Distribution, production, and historical changes in abundance of eelgrass (Zostera marina L. ) in Southeastern MA. Ph. D. Thesis, Boston University, 395 pp.
Chapter 2: Eelgrass (Zostera marina L.) production in Buzzards Bay (430 kb pdf)
Chapter 7: Stress ethylene production in four marine macrophytes(430 kb pdf)
Comment: Physiological response of eelgrass and algae to exposure of eelgrass and algae to No. 2 fuel oil, naphthalene, and toxic metals.
Appendix II: A detailed description of eelgrass in Buzzards Bay including maps, and Appendix III: Alphabetized list of mapped eelgrass beds by town. (430 kb pdf)
Comment: Though seemingly crude, these maps were produced with a simple software program developed by the author and used USGS quads as a base map. These digitized data files were later converted to ArcView GIS files to produce the maps shown below.
1988 EPA Eelgrass Report
This report contains much the same information as above, except contains additional detailed embayment specific site histories. Citation: Costa, J. E. Eelgrass in Buzzards Bay: Distribution, Production, and Historical Changes in Abundance. EPA 503/4/88-002 204 pp.
1988 Costa EPA Eelgrass Report (5.4 MB)
Costa Thesis Eelgrass GIS Data
Eelgrass Links
DEP eelgrass interactive maps.
DEP eelgrass mapping and wetland conservancy program.
MassGIS – DEP Eelgrass Data layer Description and download
Virginia Institute of Marine Science Submerged Aquatic Vegetation Page (SAV)
Chesapeake Bay Program SAV Home Page
Botos website for students (grades 7-9)
Washington state Dept. of Ecology Eelgrass page
University of Rhode Island Eelgrass Page
Rhode Island: Restoring Coastal Habitats, seagrass design considerations
Vallisneria: the other eelgrass
A freshwater aquatic plant familiar to pond goers and popular with aquarium keepers is the genus Vallisneria, which also goes by the name “eelgrass” or “eel grass,” as well as “tape grass” and “wild celery.” The most ubiquitous worldwide species is Vallisneria spiralis, although the aquarium plant sold is typically Vallisneria americana. Vallisneria can actually grow in brackish waters, up to 10 ppt salinity, whereas Zostera is typically found in salinities averaging above this concentration, so the two species do not co-occur. The two plants have a very similar appearance, however Vallisneria has a light green stripe in the center of its leaves and its leaves are broader than those of Zostera. The two aquatic grasses are in different families. The marine eelgrass Zostera is in the family Zosteracae, whereas the freshwater eelgrass Vallisneria is in the family Hydrocharitales.