Completed Parcel Level Analysis: Little River, Dartmouth | New Bedford Harbor | Slocums River | Wareham River
Related Pages: Nitrogen Loading Assumptions | Parcel Level Analysis | Massachusetts Estuaries Project
What is on this page
On this page we present summary statistics of land use in the various subwatersheds around Buzzards Bay, estimates of nitrogen loading using the Buzzards Bay NEP’ nitrogen loading model for MassGIS land use statistics, and where available, more detailed estimates of nitrogen loading based on parcel land use analysis developed by the DEP Massachusetts Estuaries Project, the Cape Cod Commission, or the Buzzards Bay NEP. Click on the table on the right side, or the links at the top of this page to see statistics for specific embayments where we have completed a parcel loading analysis.
Watershed nitrogen loading models are just one required element for establishing estuary management limits for nitrogen, referred to under federal water quality regulations as Total Maximum Daily Loads (TMDLs). In Massachusetts, watershed nitrogen is linked to an estuary water circulation model to help predict average annual total nitrogen concentrations at a sentinel stations. If the protection of eelgrass is a management priority in an estuary, a target nitrogen concentration at the sentinel station would be selected to ensure much of the estuary (on average) would be at or below 0.4 ppm total nitrogen (typically). If eelgrass were not a management priority, and the integrity of fish, shellfish, and other animal communities were the management priority instead, a nitrogen concentration at the sentinel station would be selected to ensure that much of the estuary would achieve 0.5 ppm total nitrogen or better (typically). The actual total nitrogen target concentrations selected may also depend on other factors, and issues related to setting the TMDL are discussed elsewhere on this website.
Watershed delineations
Our analysis is based on accepted delineations of Buzzards Bay watershed and subwatersheds (download the GIS data). Most of the boundaries were established by USGS and the Cape Cod Commission in the early 1990s, but they are now under review by DEP and USGS as part of the Massachusetts Estuaries Project initiative. Click on the map on at the lower right of this page to see the subwatershed delineations. Read also the information on this page about changes in the watershed boundary, which also contains Cape Cod and Buzzards Bay subwatershed shapefiles at the bottom of the page.
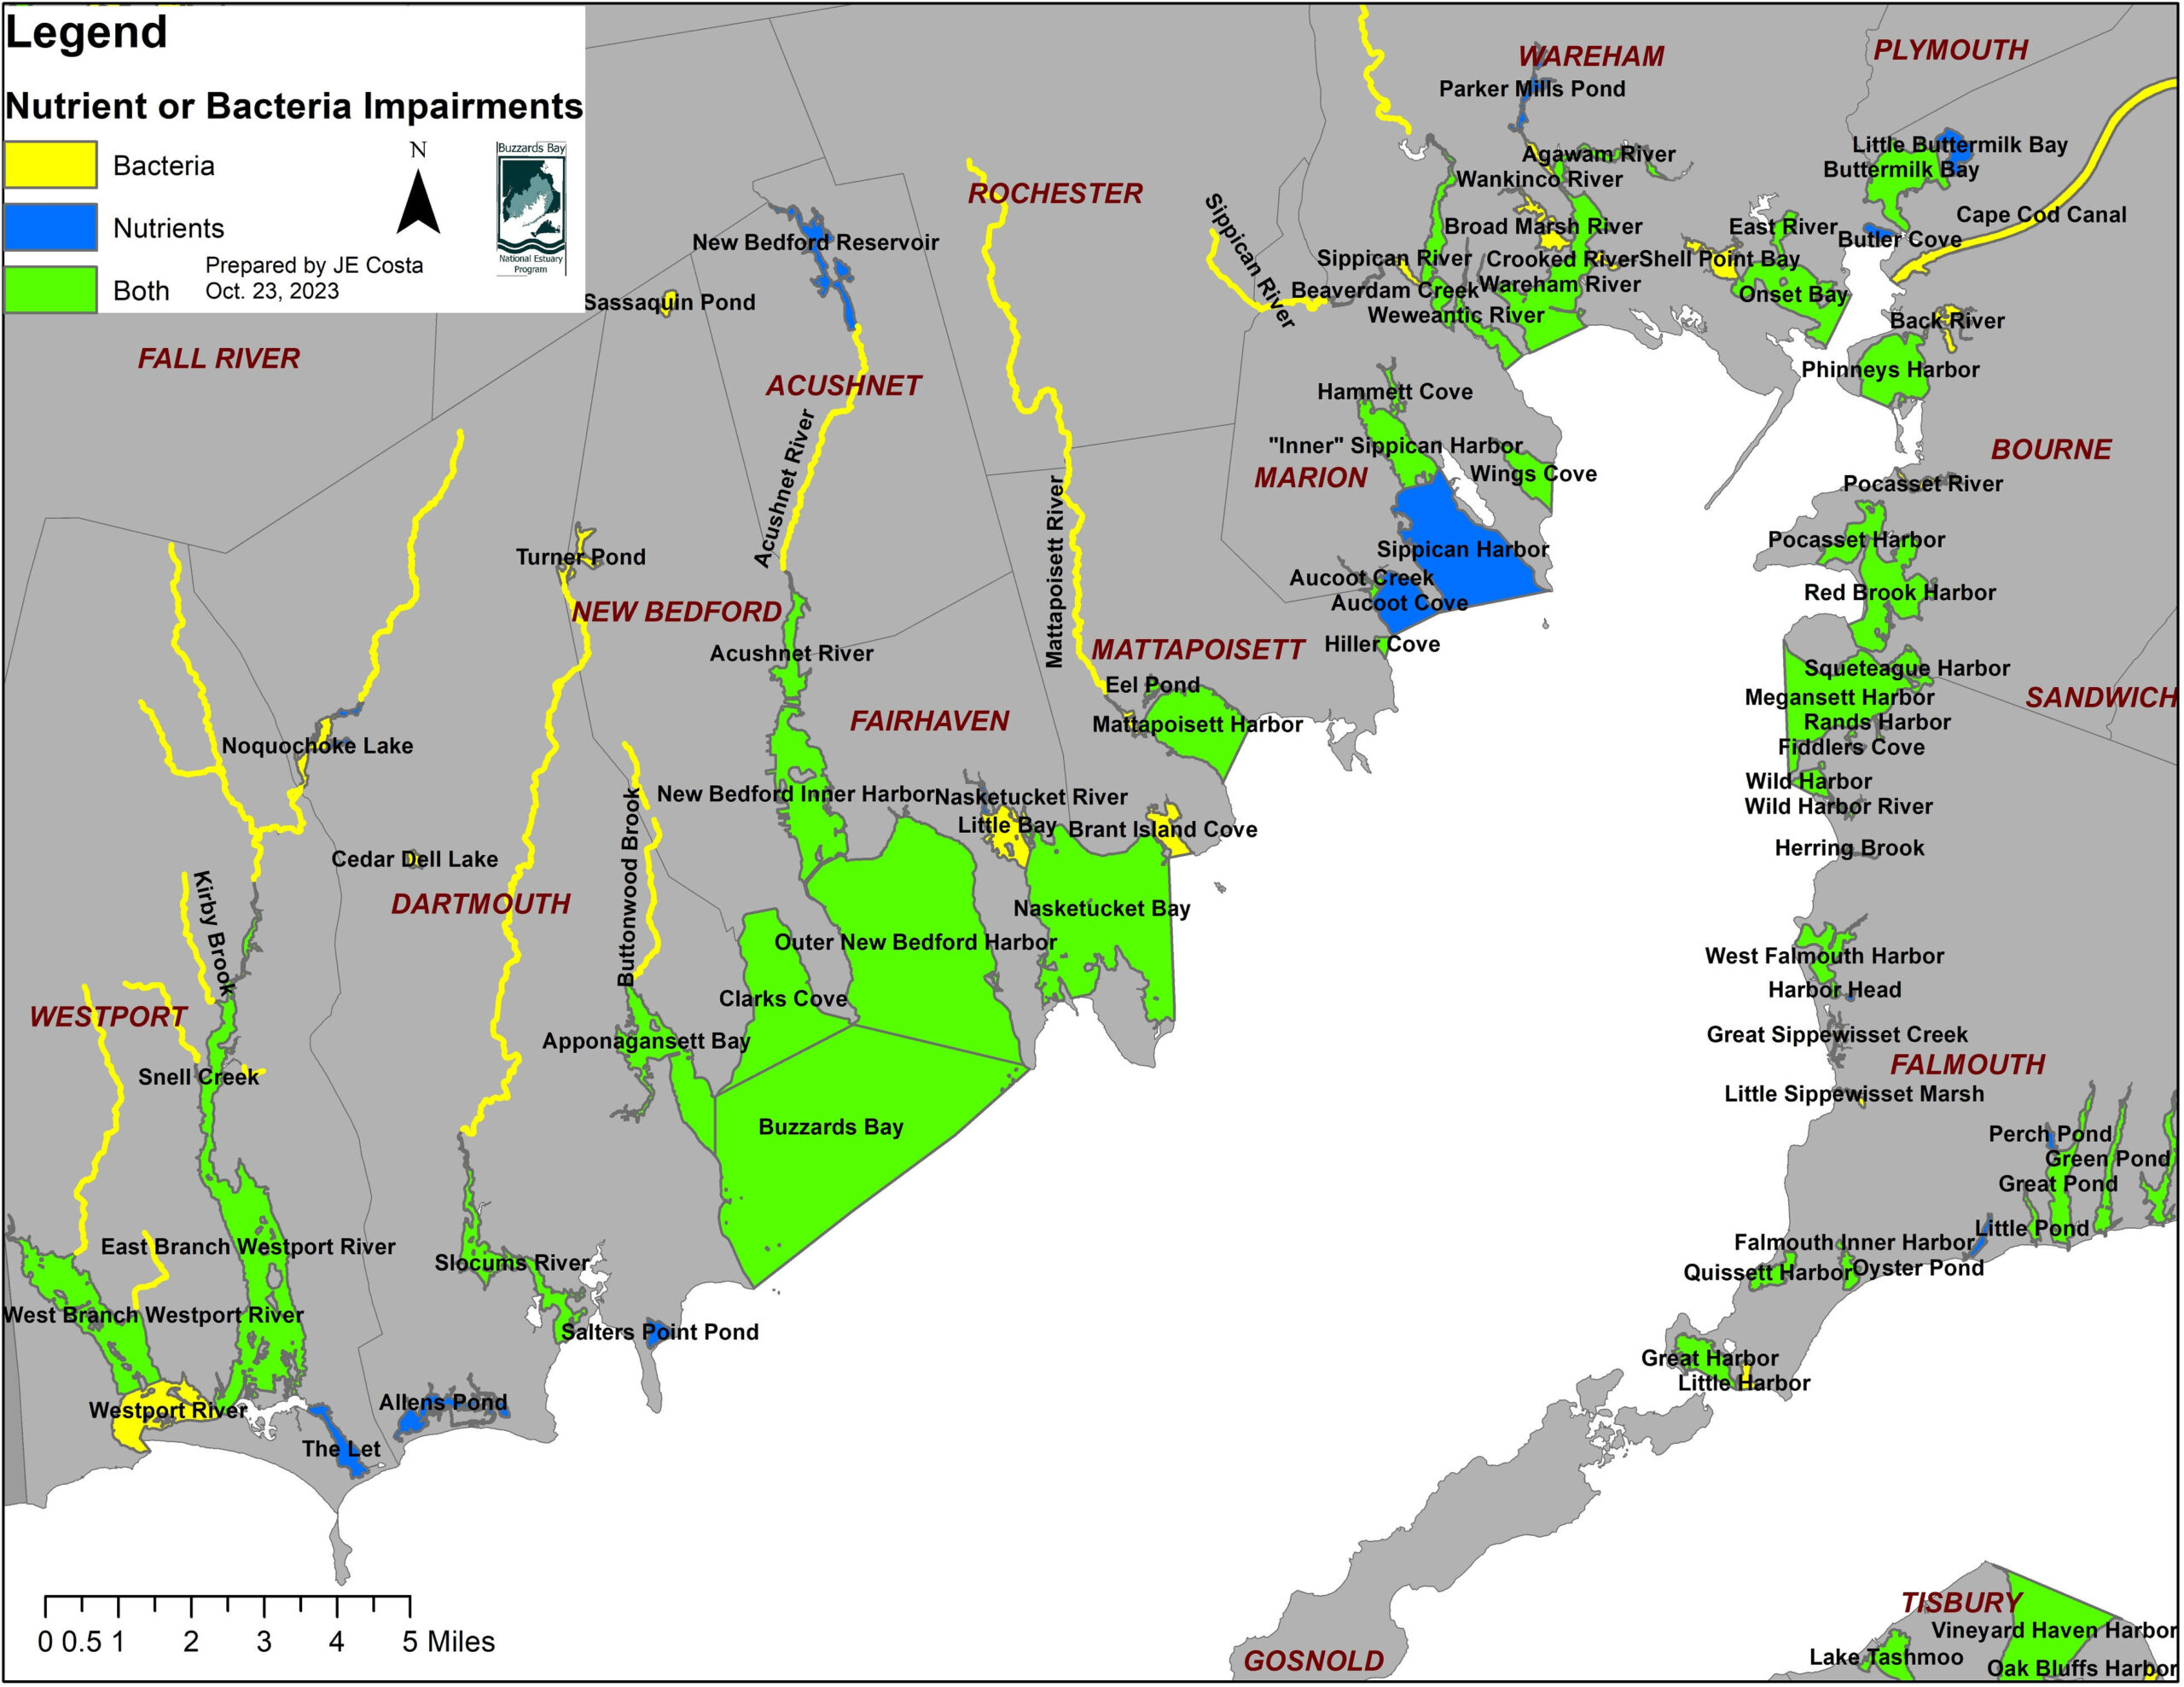
Integrated list of impaired waters
Nitrogen Loading and Land Use Spreadsheets
2004 Buzzards Bay subbasin land use statistics and embayment areas (Excel file)
See the additional data and information on our Nitrogen Management Information page.
Sewering and Wastewater Facility Discharges
Accounting for sewering, and changes in the extent of sewering represents one of the biggest challenges to managers conducting nitrogen loading analyses. This is because even after an area is sewered, because groundwater typically travels only one to two feet per day, it may take ten to twenty years for septic system contaminated groundwater flows to reach the coast from inland areas depending on soil types and groundwater flow patterns. Since 2000, many areas of Buzzards Bay have been sewered. This contrasts with the 1990s, when there was little new sewering, and most of the population growth was served by onsite septic systems. Just as sewering may not be reflected in coastal water quality for many years, these new septic systems also have not yet exerted their effect.
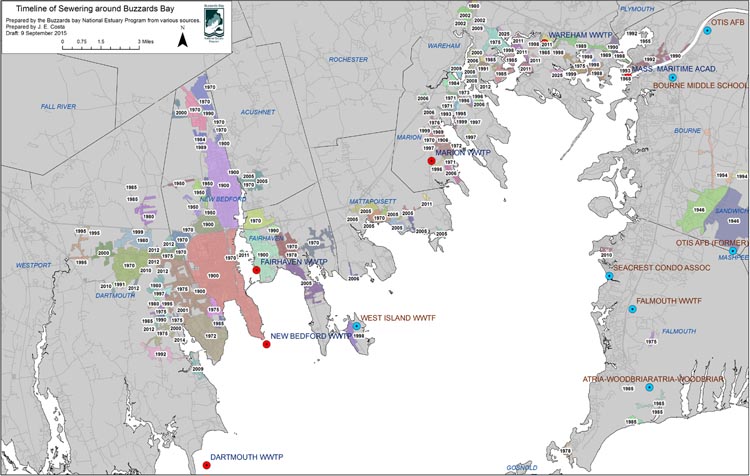
This changing landscape of sewering seen in the two maps of Buzzards Bay sewer coverage below. One represents the extent of sewering in Buzzards bay about 1995, the other represents the extent of sewering in 2008 (with some projections). Beside these changes, elimination of CSO discharges in New Bedford, upgrades in the treatment of effluent of Buzzards Bay municipal wastewater treatment facilities, increases or decreases in the change of flow of those facilities all must be accounted for in any loading analysis.


Sewering in Buzzards Bay about 1995 (left) versus expected by 2009 (right; note that Wareham sewer expansion was been delayed). Click on the maps for enlarged views.
Embayment area, bathymetry, and tidal range
This table is for a circa 2004 subwatershed boundary delineations. The BBNEP will update these summaries based on MEP-adopted subwatershed boundaries adopted for Cape Cod, and as they become available around the rest of Buzzards Bay.
| Embayment | Water area km2 | mean depth at MLW(m) | mean depth (m) at Half Tide | Vol. at MLW m3x10^6 | Vol. at Half Tide m3x10^6 | Tidal Range(m) |
| Agawam River | 0.47 | 0.50 | 0.85 | 0.23 | 0.40 | 0.70 |
| Allens Pond | 0.77 | 0.50 | 0.90 | 0.39 | 0.69 | 0.80 |
| Apponagansett, inner | 1.34 | 0.60 | 1.15 | 0.80 | 1.54 | 1.10 |
| Aucoot Cove | 1.29 | 2.22 | 2.87 | 2.86 | 3.70 | 1.30 |
| Back River- Eel Pond, Bourne | 0.08 | 0.70 | 1.20 | 0.06 | 0.10 | 1.00 |
| Brant Island Cove | 0.34 | 0.81 | 1.36 | 0.27 | 0.46 | 1.10 |
| Broadmarsh River | 0.40 | 0.30 | 0.80 | 0.12 | 0.32 | 1.00 |
| Buttermilk Bay | 2.14 | 1.19 | 1.74 | 2.55 | 3.73 | 1.10 |
| Clarks Cove | 2.86 | 3.57 | 4.12 | 10.20 | 11.77 | 1.10 |
| Eel Pond, Mattapoisett | 0.10 | 0.70 | 1.00 | 0.07 | 0.10 | 0.60 |
| Hen Cove | 0.26 | 0.83 | 1.43 | 0.22 | 0.37 | 1.20 |
| Little Bay Fairhaven | 0.74 | 1.10 | 1.66 | 0.81 | 1.23 | 1.12 |
| Little River | 0.35 | 0.58 | 1.13 | 0.20 | 0.39 | 1.10 |
| Mattapoisett upper Harbor | 1.59 | 2.84 | 3.44 | 4.52 | 5.47 | 1.20 |
| Megansett Harbor | 1.70 | 4.57 | 5.17 | 7.77 | 8.79 | 1.20 |
| Marks Cove | 0.46 | 0.78 | 1.38 | 0.36 | 0.64 | 1.20 |
| Little Bay – Inner Nasketucket Bay | 2.05 | 1.59 | 2.14 | 3.25 | 4.38 | 1.10 |
| New Bedford Harbor (Acushnet River) | 3.85 | 3.53 | 4.13 | 13.60 | 15.91 | 1.20 |
| Onset Bay | 2.39 | 1.29 | 1.84 | 3.09 | 4.40 | 1.10 |
| Phinneys Harbor | 2.17 | 2.00 | 2.60 | 4.35 | 5.65 | 1.20 |
| Pocasset Harbor | 1.00 | 2.20 | 2.80 | 2.00 | 2.60 | 1.20 |
| Pocasset River | 0.80 | 0.93 | 1.53 | 0.74 | 1.22 | 1.20 |
| Quissett Harbor | 0.47 | 1.57 | 2.17 | 0.74 | 1.02 | 1.20 |
| Red Brook Harbor | 0.61 | 1.74 | 2.34 | 1.06 | 1.43 | 1.20 |
| Sippican Harbor upper harbor | 1.70 | 1.44 | 2.04 | 2.45 | 3.47 | 1.20 |
| Slocums River | 1.97 | 0.74 | 1.29 | 1.45 | 2.53 | 1.10 |
| Squeteague Harbor | 0.30 | 0.81 | 1.41 | 0.24 | 0.42 | 1.20 |
| Wareham River | 2.49 | 0.96 | 1.56 | 2.40 | 3.89 | 1.20 |
| Weweantic River | 2.38 | 1.14 | 1.74 | 2.72 | 4.15 | 1.20 |
| West Falmouth Harbor | 0.80 | 0.58 | 1.18 | 0.47 | 0.95 | 1.20 |
| Widows Cove | 0.54 | 0.94 | 1.54 | 0.51 | 0.83 | 1.20 |
| Wild Harbor | 0.49 | 1.17 | 1.77 | 0.57 | 0.87 | 1.20 |
| Wings Cove | 0.88 | 1.39 | 1.99 | 1.22 | 1.75 | 1.20 |
| Westport River, East Branch | 8.02 | 0.77 | 1.17 | 6.21 | 9.42 | 0.80 |
| Westport River, West Branch | 5.32 | 0.78 | 1.18 | 4.17 | 6.30 | 0.80 |
Note: 1 square kilometer = 100 hectares = 247.1 acres