Related Pages: Nitrogen Loading Assumptions | Parcel Level Analysis
What is on this page
[This page was posted for a 2015 assessment of loading.]
On this page we present summary statistics of land use and wastewater characteristics prepared by the Buzzards Bay National Estuary Program for this watershed, and from these features we have estimated nitrogen loading using Massachusetts Estuaries Project nitrogen loading coefficients. We also include links to current and historical reports on pollution in the watershed issued or developed by the state, federal government, DEP, the Massachusetts Estuaries Project, non-profits, and independent scientists.
In our analysis, we have used attenuation coefficients contained in a draft Massachusetts Estuaries Project TMDL report. DEP has not yet approved the TMDL report for this watershed, and these attenuation coefficients may change in the final TMDL report.
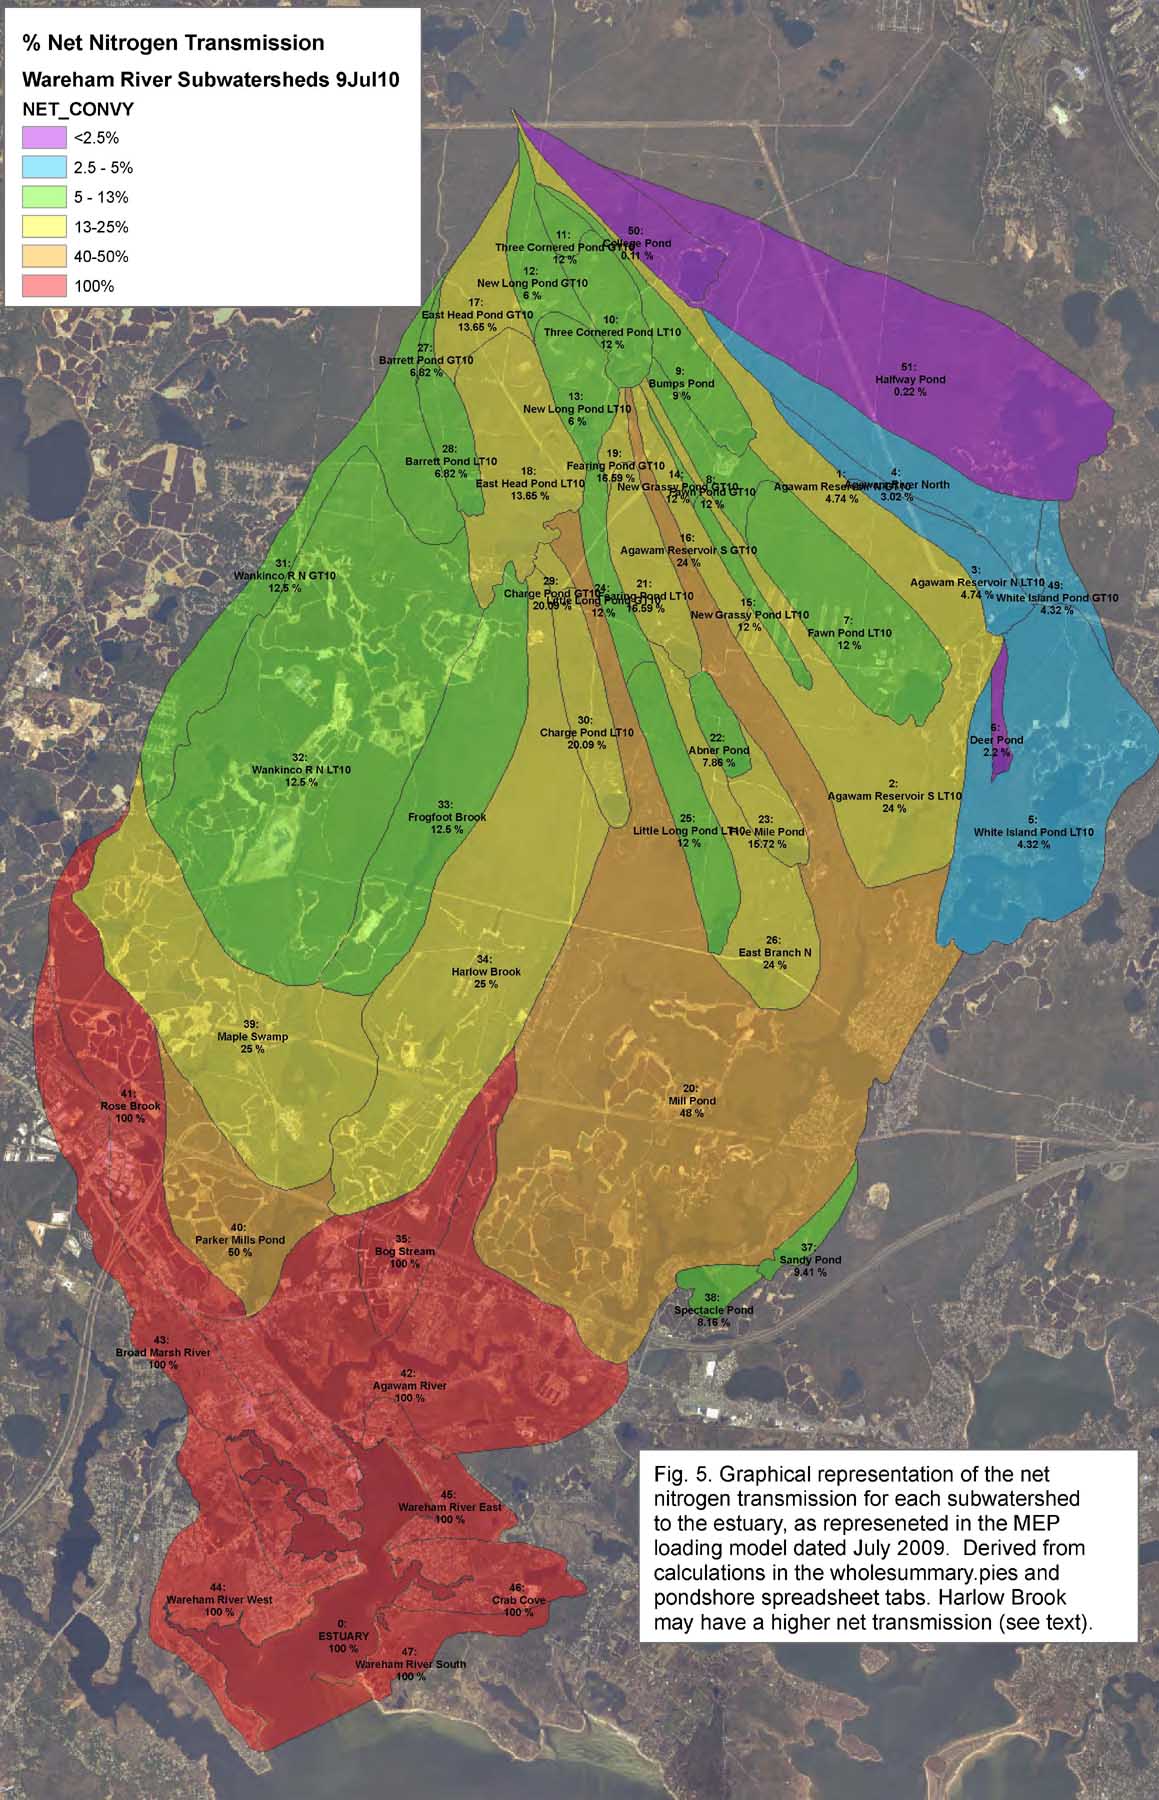
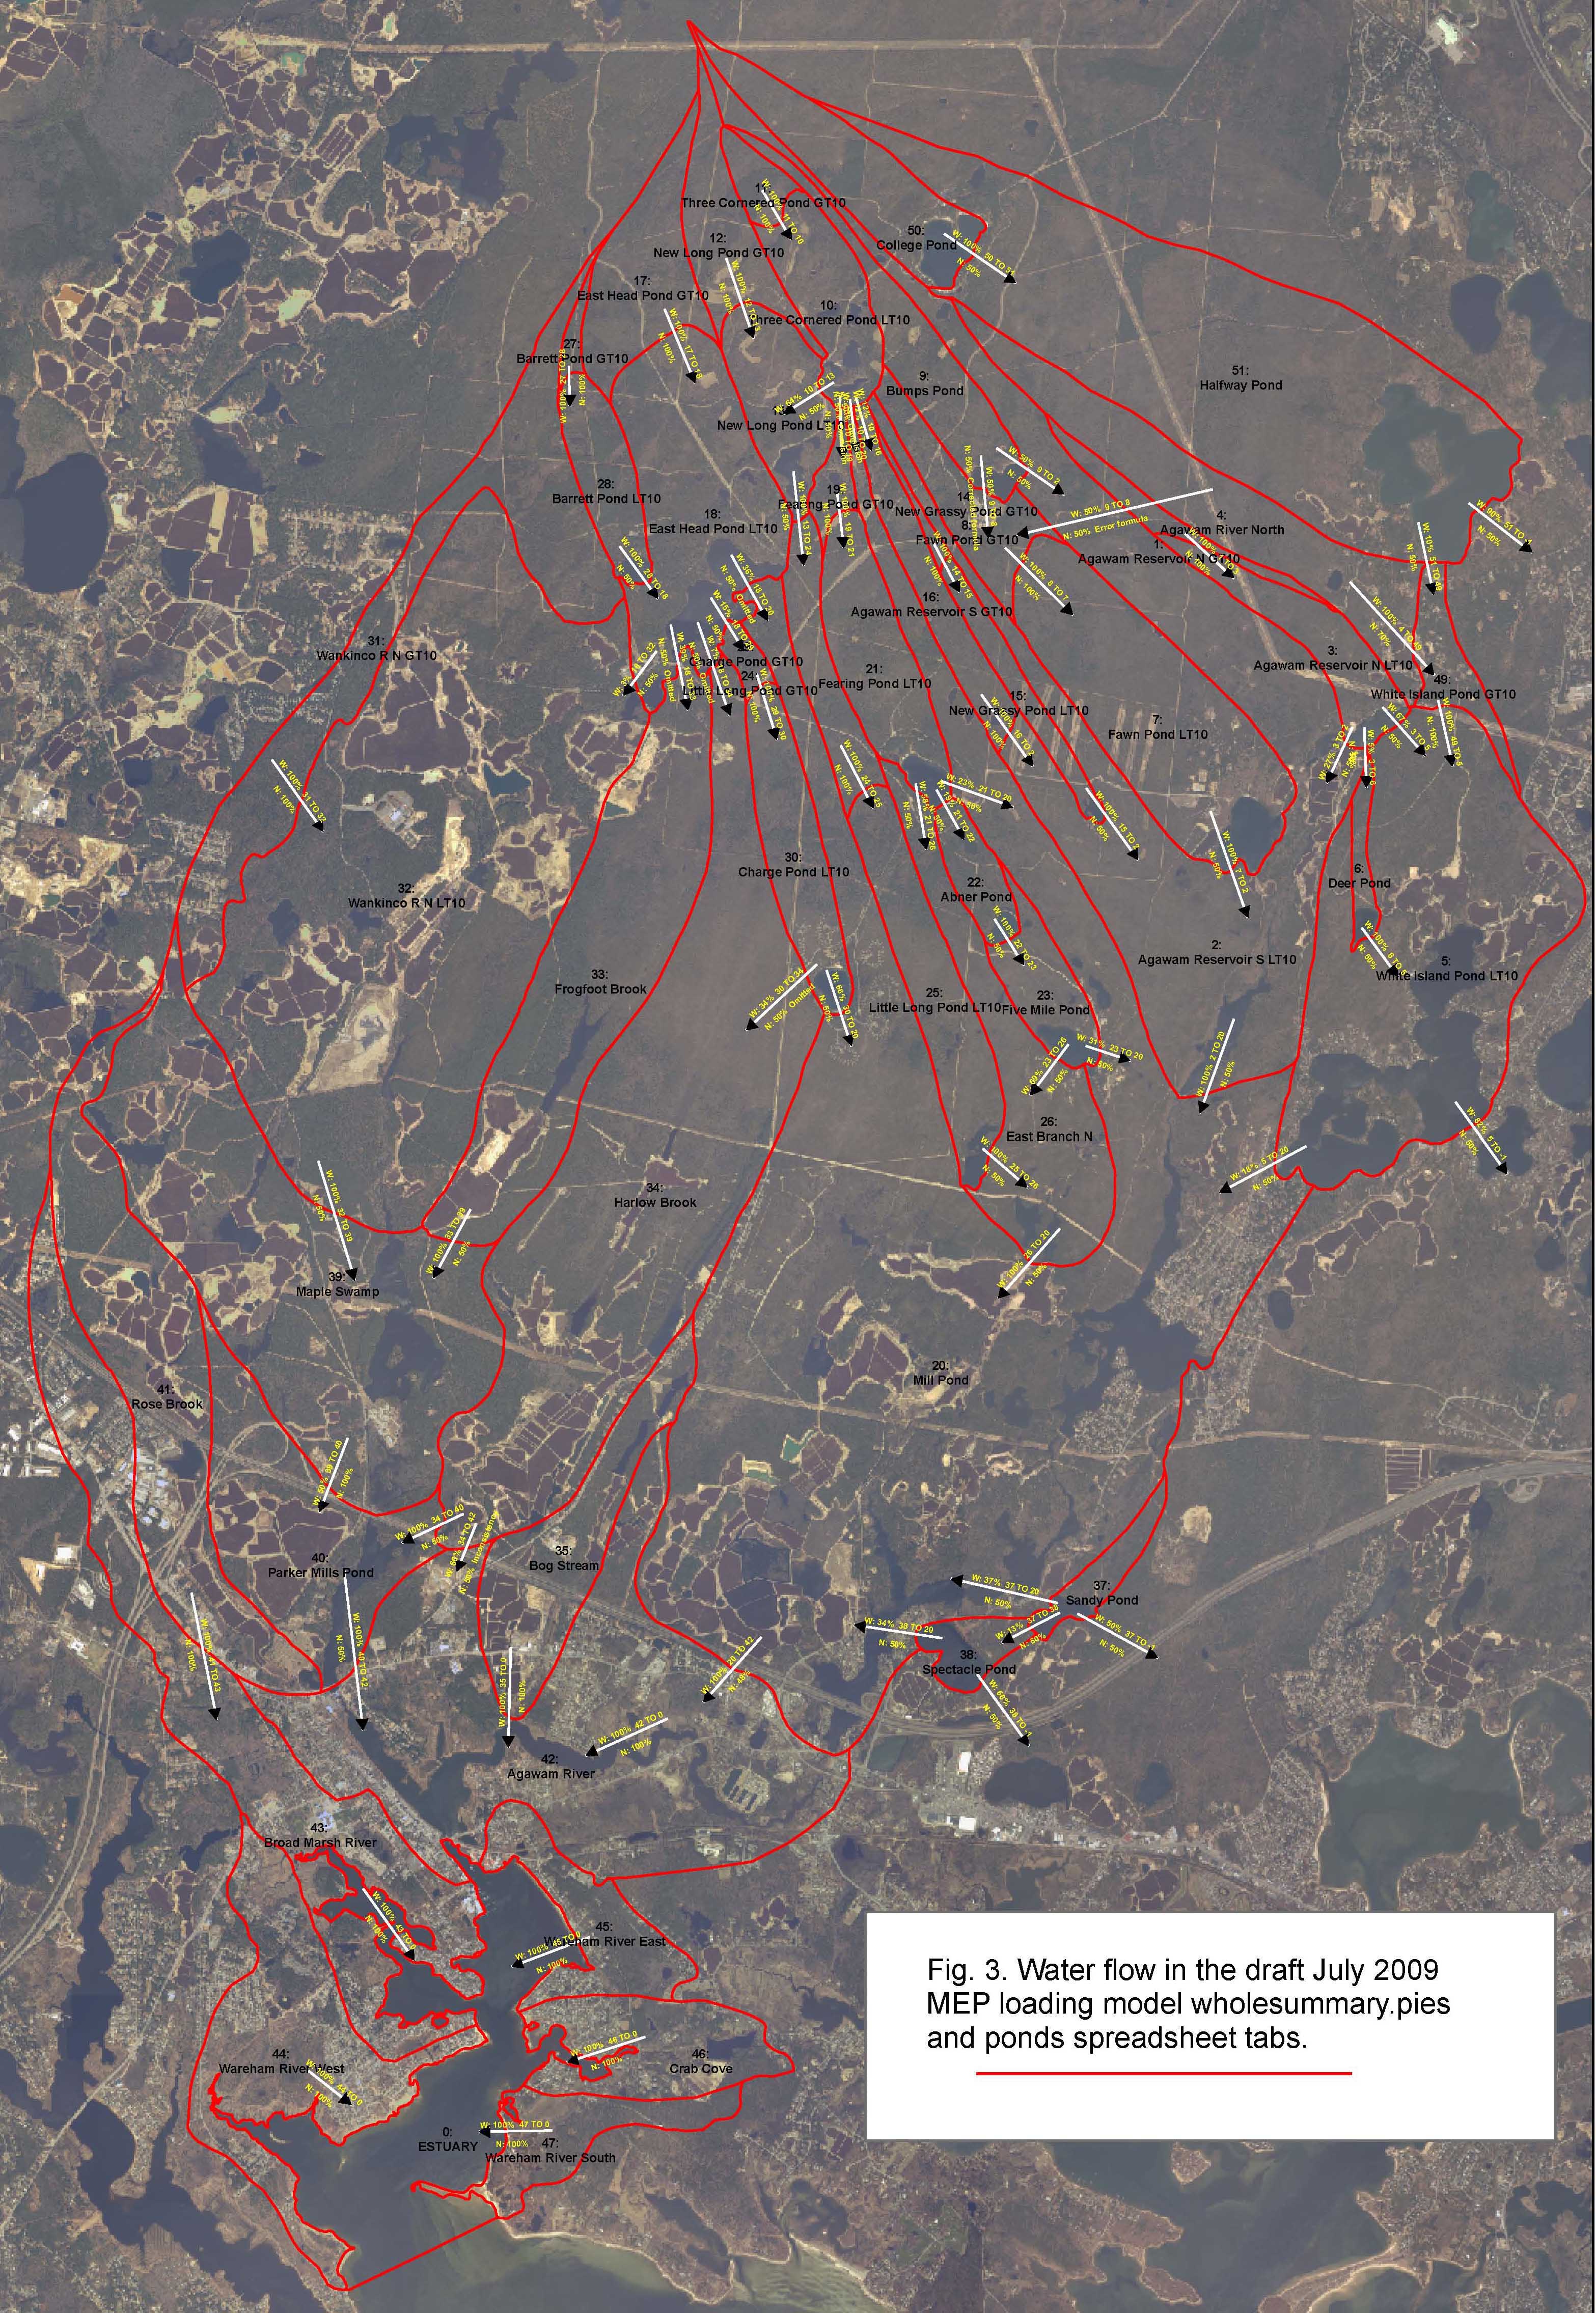
Draft MEP subwatersheds and net attenuation coefficients. The net attenuation coefficients may change on the final TMDL report for the Wareham River. Click to enlarge. This map was created by cascading the assumed water flows and nitrogen losses in this water and nitrogen conveyance map.

Planned sewer expansion areas as identified in map prepared by a consultant for the updated CWMP in 2006. Click to enlarge.

Click on wastewater service map for a larger image or open one of these files:
sewer-septic-wareham.pdf (6.5 MB pdf)
sewer-septic-wareham.kmz (2.5 MB Google Earth file)
Other Embayment Estimates
We hope the information on this page will give municipal officials, planners, and residents the opportunity to review our GIS work and data, and to help all to better understand any comments or analyses that we may convey to MA DEP or the US EPA. We also hope the information presented here will help convey a clear understanding of nitrogen loading characteristics for this watershed.
Evaluating watershed nitrogen loading is just one part of the process for establishing nitrogen TMDLs for impaired coastal waters. The Massachusetts DEP and EPA are setting these TMDLs based on studies being conducted by the Massachusetts Estuaries Project. More information about this effort can be found on the MEP Oceanscience.net site, UMass Dartmouth SMAST site, and this DEP TMDL page.
Watershed delineations
The watershed used for the analysis presented on this page is the subwatershed adopted by the Massachusetts Estuaries Project, and is based on an MEP interpretation a USGS groundwater hydrology model and includes 49 subbasins with complex flow pathways (see figure 7 in USGS study; see also metadata information at water.usgs.gov/GIS/metadata/usgswrd/XML/ds451_gwcontrib_areas.xml). The larger subwatershed is similar to the original the watershed adopted by the Buzzards Bay NEP in 1990, with some important exceptions as described on our Buzzards Bay watershed changes page.
Subwatersheds and Attenuation
As of December 2009, the Massachusetts Estuaries Project used the subwatersheds boundaries with the net nitrogen transmission coefficients as graphically represented in the pdf map links below and images to the right (as interpreted by the BBNEP). This is the most complex subwatershed watershed delineation model adopted by the Massachusetts Estuaries Project. The water flow patterns incorporated into the MEP model are based on an interpretation of a groundwater flow model developed by the USGS (unpublished elements from the report cited above). The attenuation coefficients for each subwatershed are based on the assumption of a 50% loss of nitrogen in water transfers from one subwatershed to the next, where there is a pond at the subwatershed boundary. It is not based on any specific subwatershed monitoring data (except for the Mill Pond subwatershed), but is rather based on measurements on the Mill Pond subwatershed, which are also consistent with watershed transfers documented on Cape Cod. Although the Wareham River Estuary TMDL is in draft form and is subject to change, we are presenting this graphical representation of the MEP watershed attenuation model here because this nitrogen loading model is being used the developer A. D. Makepeace in their permit applications for two mixed use development projects covering 6,000 acres in the towns of Carver, Wareham, and Plymouth, and by the Massachusetts DEP to evaluate these permits and review nitrogen discharges to groundwater, including a 250,000 gpd groundwater discharge proposed in the Town of Plymouth. An explanation of how flows and attenuations are daisy-chained in loading calculations can be found on this page: wareham-river-loading-demo3.htm. The actual calculation spreadsheet is provided below.
PDF map Wareham River watershed Net N Transmission
PDF map Wareham watershed water and nitrogen coefficients
nitrogen transmission calculations spreadsheet (This spreadsheet allows changes in presumed attenuation. For example, if the assumed subwatershed nitrogen transmission default is changed from 50% to 60%, attenuated watershed loading plugged into the loading spreadsheet below, this change increases nitrogen loading to the estuary from 95,139 to 98,943 lbs per year.)
Special issues associated with the Wareham datasets.
This analysis required combining information from the Assessor’s office, Water District, and sewer billing information from the Tax Collector. Combining data from these databases posed special problems for this watershed analysis. Of the roughly 20,280 parcels recorded on Wareham Assessor maps, roughly 14,000 parcels have separate records in the Assessor’s database. The apparent missing lots are in fact those lots that are under common ownership and single use (e.g. several undersized lots may have been functionally merged to build a house, but the merged lots were not merged at the County Deeds office). The extra lots are listed under their master lots in an “extra lot” or comment field, but the extra lot field is incomplete. In addition to these issues, 1000s of acres of parcels owned by Makepeace Company are not included in the digital database because they are billed under a separate process.
A further complication is that the town’s existing GIS data was based on the 1990s assessors office CAMA software data (Massachusetts computer-assisted mass appraisal system; see www.mass.gov/Ador/docs/dls/it/pdfs/CAMA1.PDF), but about 1995, the town Assessors office abandoned the CAMA software and replaced it with the Vision software, which has a different map-lot coding system.
All these discrepancies in map lot coding between the databases complicated database joining, and for this reason the GIS database was modified merging combined lots to coincide with the Assessors current database (about 8000 Wareham Assessor records for this watershed). This process also required numerous visual reviews to ensure water department and sewer department records were properly matched to the GIS data.
Sewering and Septic Use
Sewered properties in Wareham are served by the Wareham wastewater facility. No portion of Carver is sewered, nor is any portion of Plymouth in the Wareham River estuary watershed.
The Buzzards Bay NEP determined the extent of sewering in Wareham by matching sewer bill accounts to parcels. This process is more accurate than relying on Assessors data because the database fields associated with utilities in assessor databases are not a required field, and the information is often incomplete or out of date. This process is not 100% perfect, so we also send these maps to municipalities for review. The maps for this watershed were sent to the Sewer Department and tax collector for review.
While there has been considerable expansion of the Wareham sewer system since 2000, the expansion has occurred almost exclusively outside the Wareham River Watershed. More than 720 homes within the watershed will be sewered by the town between 2010 and about 2014. Sewer lines were laid in portions of the watershed, but the actual disconnection and tie ins did not begin for any area until late 2010.
| Year | parcels with wastewater | parcels with sewer | parcels with septic systems | buildings with wastewater* | number of septic systems** | units served by septic systems |
| 2005 | 5,134 | 1,939 | 3,195 | 5,965 | 3,858 | 3,888 |
| 2009 | 5,249 | 1,958 | 3,291 | 6,130 | 3,967 | 3,997 |
*This estimate includes structures with presumed wastewater service (sewer or septic) and does not include residential garages or other accessory commercial or residential structures. A two-family dwelling may consist of two units (condos or apartments) in one structure. **The number of septic systems may be slightly less than the number of buildings served by septic systems (not shown) because two buildings on one parcel may have been presumed to share a septic system. For any given watershed, the number of units, buildings, and septic systems are not equal. There are more “units” in a watershed than “buildings” because a building may have multiple residential or business units. For example, a two-family dwelling may consist of two units (condos or apartments) in one structure, but that one structure may be served by a single septic system. For septic system loading calculations, units is probably the best value to use of the three parameters.
Note that for this watershed, the number of parcels flagged as served by septic did not increase as much as the number of septic systems in the watershed. This is because the town’s GIS parcel coverage is not up to date with respect to new subdivisions and condominium structures, so a number of parcels have more units or buildings on them than their use code might suggest.
Septic Use by Town
In the table below is a summary of the septic system numbers in each municipality in the watershed. This breakdown does not represent the relative contribution of septic loading from each town, because only a small portion of septic nitrogen in the upper watershed reaches the bay (see loading table below).
| Town | 2005 onsite systems | 2005 Units served | percent | 2009 onsite systems | 2009 Units served | percent |
| Carver | 209 | 209 | 5.4% | 209 | 209 | 5.2% |
| Plymouth | 303 | 303 | 7.8% | 319 | 319 | 8.0% |
| Wareham | 3346 | 3376 | 86.8% | 3439 | 3469 | 86.8% |
| Total | 3858 | 3888 | 3967 | 3997 |
Residential Water Use
The Buzzards Bay NEP determined the extent of water use in Wareham by matching Wareham Water District records to GIS parcel data. The Onset Water District does not provide water service to this watershed. Because the Water District database does not precisely match the GIS data of Sewer Department database coding, both map-lot and street addresses were matched and reviewed in this process. The maps for this watershed were sent to the Wareham Water District for review and comment. The Buzzards Bay NEP estimated a 99% matching accuracy of water department records to the parcel database through this process
As of 2010, an estimated 828 properties in the watershed had well water and an estimated 5,464 had municipal water. Of the properties that had water use >0 (i.e. properties occupied at least some portion of the year), the following is the average water use per account for key residential land use codes. Note that the higher water use for the two-family unit may be the result of the fact that many of these properties may have a single water meter for the property. Water use would be somewhat lower if vacant properties were included.
| Water Accounts broken down by sewer and septic users in the town of Wareham portion of the watershed | ||||
| USE_CODE | # on SEPTIC | # on SEWER | SEPTIC GPD | SEWER GPD |
| 101 (single family) | 2131 | 1483 | 134.5 | 145.3 |
| 102 (condominium) | 50 | 32 | 118.0 | 157.9 |
| 104 (two-family) | 21 | 45 | 185.5 | 337.3 |
The average water use for all properties in the watershed is approximately 140 gpd. For those properties with septic systems, the average water use is just under 136 gpd. For the loading table below, we multiplied the total number of units served by septic systems times the average septic water use of 134.5 gpd. Using the MEP groundwater discharge concentrations from septic systems, this water use results in an effective loading rate of 9.68 pounds per unit.
The low average water use in this watershed likely reflects a large seasonal occupancy in portions of the watershed. Several independent databases suggest seasonal residency, as illustrated by the maps below showing 2000 Census data vacancy rate, 2009 water use rate, and non-Wareham tax billing addresses in the Assessor database (shaded purple, only single-family-home properties highlighted). In each map, polygons shaded purple are parcels or areas with a likely seasonal population.

Click picture to enlarge.
Actual average water use varies by subwatershed. As shown above, some neighborhoods in coastal villages, like Parkwood Beach, had 60-90% vacancy rates in the 2000 US Census. Because the Census is taken in the spring, this suggests that most of these properties were occupied only in the summer a decade ago. More recent information and data suggests there is increased year-round occupancy in these neighborhoods, possibly as rental properties or conversion to primary residences. Below is the 2009 water use by properties with septic systems served by the Wareham Water district, for watersheds served by this water district. Note that these subwatershed boundaries include both areas with seasonal and year-round populations. When evaluating water use data, an important confounding factor is the fact that in some subwatersheds, lawn irrigation or average lawn size may be larger than in other areas. The presumption is that on average, occupancy rate more strongly affects water use that parcel size in different portions of town.
When average water use is applied to the entire watershed in the loading spreadsheet, annual total attenuated watershed nitrogen loading is 95,139 lbs. If actual subwatershed water use (where known) is applied to the loading calculations, total attenuated watershed nitrogen loading increases to 97,527. The difference is the result of the fact that subwatersheds (nearest the bay, including portions of central Wareham) have slightly higher water use than some areas in the upper watershed.
Average Water Use for Single Family Homes with Septic Systems by Subwatershed (Wareham properties only)
| Subwatershed | SUBWAT_ID | number of records | avg water use GPD per acct |
| Mill Pond | 20 | 836 | 121.3 |
| Agawam River | 42 | 460 | 164.1 |
| Crab Cove | 46 | 296 | 128.1 |
| Wareham River East | 45 | 242 | 104.5 |
| Broad Marsh River | 43 | 130 | 189.4 |
| Wareham River West | 44 | 100 | 118.6 |
| Bog Stream | 35 | 22 | 175.2 |
| White Island Pond LT10 | 5 | 22 | 78.7 |
| Rose Brook | 41 | 21 | 131.4 |
| Wareham River South | 47 | 14 | 226.3 |
| Harlow Brook | 34 | 14 | 168.5 |
| Maple Swamp | 39 | 7 | 467.0 |
| Parker Mills Pond | 40 | 7 | 154.3 |

Average water use in GPD for properties with septic systems (data for Town of Wareham only). Click to enlarge
Wastewater Facility and Other Permitted Discharges
There are no groundwater wastewater facility discharges in this watershed that require a state permit (i.e. none greater than 10,000 gpd). There are no major NPDES discharges to surfaces waters in this estuary watershed, except for the Wareham sewage treatment facility, also known as the Water Pollution Control Facility (WPCF). Under the Wareham WPCF permit, the town is required to report on a monthly basis the average Total Nitrogen concentration of the effluent, average daily nitrogen loading, and average flows, among other parameters. The current permit contains a seasonal average effluent limit of 4.0 mg/l (=ppm) for total nitrogen for the months of April through October. The discharge limit is 1.56 MGD. The average seasonal loading limit is 52 lbs of N per day. The graphs below show the data the Town reported to EPA for the past several years (the data is available for download at the EPA Enforcement and Compliance History Online site.


The decrease in flow from the WPCF between 2005 and 2008 can be explained by a town program to reduce inflow of stormwater connections and infiltration of groundwater into leaky pipes (“I&I” improvements; a requirement of the 2005 permit). The increase after 2008 is likely due to expansion of the sewer line system in the town under the current approved Facilities Plan and Comprehensive Water Management Plan. Increased flow will continue as the town sewers more areas as shown by the map above right (roughly another 1,100 units still need to be sewered, which will likely further increase flows by at least 165,000 MGD, plus any other commercial sites that may be added). About 720 of these units will be in the Wareham River Estuary watershed (read our explanation in this August 2, 2010 letter to the CBB).


The average daily nitrogen loading for the period July 2005 to December 2006 (roughly the period of the MEP water quality and loading analysis) was 56.17 lbs per day lbs per day (20,502 pounds per year, = 9,302 kg). For the period June 2009 to June 2010, daily load averaged 45.80 pounds per day, which totaled 16,717 pounds annually (7,585 kg). In the loading table below, we use the 2005-6 data. The average nitrogen concentration of all months between January 2007 and December 2009 was 4.88 ppm.
It is worth noting that there is no correlation between flows and concentration, but any signal is masked by the higher wintertime nitrogen concentrations, due to shifts in wastewater treatment. There are different ways to weight the data, and these loading estimates may not be precisely equivalent to the loading estimates used by the MEP. There are also discrepancies on some dates between reported pounds per day and a recalculation of these values based on reported flows and concentrations, and some of these discrepancies may be the result of data entry errors. To review these calculations, and the basis of these graphs, review this spreadsheet: wareham-wpcf-128741395813155.xls.
Impervious Area Calculations
In nitrogen loading calculations, analysts prefer to use actual roof and parking areas in town GIS coverages, but this data is not often available. Consequently, other estimates are used, and in the 1990s, the BBNEP often used an average roof area for each property of 1,500 square feet, and each driveway area of 1,500 square feet. The MEP used this methodology for many watersheds of Cape Cod and the Islands. The above impervious constants are not appropriate for commercial areas, and no a priori assumptions are adequate for older urbanized portions of watersheds. To address this problem, the BBNEP has begun using the MassGIS impervious cover coverage in our watershed loading estimates as described on this using MassGIS impervious coverage webpage.
A sample of the impervious cover used in our loading analysis is shown on this map: bbnep-wareham-river-imperv.pdf. If you have Google Earth installed on your computer, open these impervious on parcels and impervious on roads files: wareham_imperv_parcels.kmz (3.2 MB) and wareham_imperv_roads.kmz (5.0 MB).
Cranberry Bog Loadings
Nitrogen loading from cranberry bog fertilizer use is a large contributor to overall watershed loading in this watershed, and as a percentage of total loading, cranberry bogs contribute more nitrogen than in any watershed previously assessed by the MEP (only in the Weweantic River watershed will cranberry bogs contribute a greater percentage of loading). In past approved MEP TMDL reports on Cape Cod, the MEP assumed an annual nitrogen application rate of 31 pounds per acre with 66% leaching, for a net loading rate of MEP uses a loading rate of 20.46 lbs/acre. However, in evaluating more recent studies of nitrogen flow and loses in cranberry bogs, the MEP will purportedly adopt a reduced loading coefficient for cranberry bogs in this watershed. Moreover, because many cranberry bogs are in portions of the watershed with appreciable nitrogen attenuation (see map above), attenuated nitrogen contributions from cranberry bogs is roughly only 37% of the unattenuated loads.
Nitrogen Loading and Land Use Spreadsheets
Below is a summary of attenuated watershed loading from some key land use features and watershed, using the various loading assumptions described above. It includes some approximations, but can be used to compare to other nitrogen loading estimates. The annual nitrogen loading of 95,142 pounds equals 43,167 kg.
| Unattenuated Subwatershed Loading (in lbs) | SUB ID | precip on natural surface | precip runoff | Cranberry Bogs | Other Ag | lawn fertilizer | septic systems | Wareham wwtf | unatten total | NET N Trans | ATTEN Load |
| Mill Pond | 20 | 5,248 | 3,736 | 8,627 | 0 | 592 | 10,623 | 0 | 28,826 | 48.00% | 13,837 |
| WAREHAM WWTF | 42 | 20,502 | 20,502 | 100.00% | 20,502 | ||||||
| Agawam River | 42 | 2,292 | 3,504 | 469 | 8 | 611 | 8,060 | 0 | 14,943 | 100.00% | 14,943 |
| Wankinco R N LT10 | 32 | 1,428 | 804 | 8,374 | 0 | 3 | 58 | 0 | 10,667 | 12.50% | 1,333 |
| ESTUARY | 0 | 8,709 | 12 | 0 | 0 | 0 | 0 | 0 | 8,721 | 100.00% | 8,721 |
| White Island Pond LT10 | 5 | 3,809 | 550 | 1,965 | 0 | 121 | 2,167 | 0 | 8,612 | 4.32% | 372 |
| Broad Marsh River | 43 | 306 | 2,739 | 0 | 20 | 636 | 4,228 | 0 | 7,929 | 100.00% | 7,929 |
| Maple Swamp | 39 | 1,534 | 502 | 4,030 | 28 | 2 | 39 | 0 | 6,135 | 25.00% | 1,534 |
| Harlow Brook | 34 | 1,211 | 527 | 3,710 | 0 | 11 | 194 | 0 | 5,653 | 25.00% | 1,413 |
| Rose Brook | 41 | 504 | 1,237 | 2,785 | 14 | 57 | 784 | 0 | 5,379 | 100.00% | 5,379 |
| Crab Cove | 46 | 228 | 595 | 161 | 31 | 187 | 3,348 | 0 | 4,548 | 100.00% | 4,548 |
| Halfway Pond | 51 | 3,053 | 333 | 212 | 0 | 8 | 145 | 0 | 3,752 | 0.22% | 8 |
| Wareham River West | 44 | 208 | 1,323 | 174 | 0 | 608 | 1,277 | 0 | 3,590 | 100.00% | 3,590 |
| Parker Mills Pond | 40 | 501 | 454 | 2,411 | 0 | 8 | 145 | 0 | 3,519 | 50.00% | 1,759 |
| Wareham River East | 45 | 108 | 594 | 0 | 17 | 171 | 2,612 | 0 | 3,501 | 100.00% | 3,501 |
| Wankinco R N GT10 | 31 | 286 | 461 | 369 | 0 | 109 | 1,954 | 0 | 3,179 | 12.50% | 397 |
| Bog Stream | 35 | 271 | 741 | 1,186 | 0 | 25 | 455 | 0 | 2,677 | 100.00% | 2,677 |
| Agawam Reservoir S LT10 | 2 | 1,061 | 414 | 915 | 0 | 10 | 184 | 0 | 2,584 | 24.00% | 620 |
| Frogfoot Brook | 33 | 644 | 231 | 1,686 | 0 | 0 | 0 | 0 | 2,560 | 12.50% | 320 |
| East Head Pond LT10 | 18 | 1,270 | 277 | 0 | 5 | 0 | 0 | 0 | 1,552 | 13.65% | 212 |
| Fawn Pond LT10 | 7 | 762 | 248 | 194 | 0 | 9 | 155 | 0 | 1,368 | 12.00% | 164 |
| All others | NA | 5,825 | 1,784 | 412 | 0 | 50 | 900 | 0 | 8,971 | NA | 1,381 |
| Grand Total (lbs) | 39,256 | 21,064 | 37,679 | 122 | 3,218 | 37,327 | 20,502 | 159,169 | 0.00% | 95,142 | |
| Attenuated Subwatershed Loading (values in lbs) | SUB ID | precip on natural surface | precip runoff | Cranberry Bogs | lawn fertilizer | septic systems | Wareham wwtf | attenuated total | % of total |
| Agawam River | 42 | 2,292 | 3,504 | 477 | 611 | 8,060 | 0 | 14,943 | 15.71% |
| Mill Pond | 20 | 2,519 | 1,793 | 4,141 | 284 | 5,099 | 0 | 13,837 | 14.54% |
| ESTUARY | 0 | 8,709 | 12 | 0 | 0 | 0 | 0 | 8,721 | 9.17% |
| Broad Marsh River | 43 | 306 | 2,739 | 20 | 636 | 4,228 | 0 | 7,929 | 8.33% |
| Rose Brook | 41 | 504 | 1,237 | 2,798 | 57 | 784 | 0 | 5,379 | 5.65% |
| Crab Cove | 46 | 228 | 595 | 192 | 187 | 3,348 | 0 | 4,548 | 4.78% |
| Wareham River West | 44 | 208 | 1,323 | 174 | 608 | 1,277 | 0 | 3,590 | 3.77% |
| Wareham River East | 45 | 108 | 594 | 17 | 171 | 2,612 | 0 | 3,501 | 3.68% |
| Bog Stream | 35 | 271 | 741 | 1,186 | 25 | 455 | 0 | 2,677 | 2.81% |
| Parker Mills Pond | 40 | 250 | 227 | 1,206 | 4 | 73 | 0 | 1,759 | 1.85% |
| Maple Swamp | 39 | 384 | 126 | 1,015 | 1 | 10 | 0 | 1,534 | 1.61% |
| all others | — | 2,002 | 819 | 2,581 | 43 | 776 | 0 | 6,221 | 6.54% |
| WAREHAM WWTF | 42 | 0 | 0 | 0 | 0 | 0 | 20,502 | 20,502 | 21.55% |
| Grand Total (lbs) | 17,779 | 13,708 | 13,806 | 2,627 | 26,721 | 20,502 | 95,142 | 100.00% |
These pie charts are based on 2005 conditions. The nitrogen loading from the wastewater facility declined abruptly after facility improvements in 2005 and 2006, but loading is increasing somewhat as the sewer system has expanded in the town. For septic loading, a water use of 134.5 gpd (x 90% to adjust for non-wastewater use as per the MEP methodology) was used in the calculation.
Note also that, unlike some other watershed loading assessments, the relative contribution of nitrogen sources is different between the relative contribution of each source between attenuated and unattenuated loadings. This is because more than any other watershed where attenuation has been evaluated by the MEP, upper watershed losses are most pronounced in this watershed. Contributing to the skewing of source relative contributions is the fact that most residential and urban development is in the lower unattenauted areas and most of the agriculture (cranberry bogs) is in the upper subwatersheds, many of which are presumed to have little net nitrogen transmission to the estuary.


Although septic system and cranberry bog loading are approximately equal in their discharge to the watershed, because so much of the nitrogen in the upper watershed is presumed (under the draft MEP groundwater model; see color coded subwatershed map above) to either leave the watershed (such as the areas at White Island Pond and above), or to have nitrogen taken up or metabolized by plants and bacteria (biological attenuation), septic systems and stormwater close to the estuary, together with the wastewater plant discharge, are the dominant nitrogen sources reaching the estuary. Similarly, 13.2% of the watershed septic systems (and approximately their watershed loadings) are found in Carver and Plymouth, but these onsite systems are in subwatersheds where little nitrogen is presumed to reach the estuary, so they account for only 1.7% of the attenuated septic system nitrogen loading reaching the estuary. In general, the total attenuated loading in each category changes depending on the distribution of those nitrogen sources in the various subwatersheds.
In the analysis presented here, each residential unit discharges 9.68 lbs N to groundwater. After an additional 720 homes around the estuary are sewered, because this sewering is in an area of the loading model with no nitrogen losses (100% transmission), attenuated nitrogen load to the estuary would decline by roughly 7,000 lbs (3,200 kg), with net loading to the estuary reduced to 88,172 lbs (40,006 kg), or in the case of “controllable loads”, to 70,393 lbs (31,939 kg).
Sensitivity Analyses
The average water use in this estuary calculated by the BBNEP (134.5 gpd per septic unit was used on this page) is considerably lower than many other subwatersheds in Buzzards Bay. In the MEP nitrogen loading methodology, average watershed or subwatershed water use is used as a proxy for estimating population and occupancy (and thus septic wastewater loading) in the watershed. This lower water use suggests a large number of units in this watershed are seasonal, which is born out by the maps above of census occupancy, assessor billing records, and variations of water use in different villages. The graph below, showing septic loading reaching the estuary (attenuated loading), illustrating how increasing average water use from increased year-round occupancy might affect total septic system loading estimates reaching the estuary.
The MEP has been using 20.46 pounds per acre for loading from cranberry bogs. This may be reduced in the MEP loading model based on evaluation of new studies. The graph below shows how the contribution of cranberry bogs to the estuary (attenuated load) may diminish with lower assumed cranberry bog loading rates.


For this analysis, we used an average water use of 134.5 gpd per septic use, which yields an annual nitrogen loading of 9.68 lbs per unit for septic wastewater loading. If instead we used each actual subwatershed average water use where available, and for all other subwatershed we used the whole watershed average of 9.68 pounds per unit, watershed loading would increase slightly, with attenuated septic system nitrogen loading increasing from 28.1% of total estuary loading to 29.9% of total estuary loading (and increase to 36.5% of controllable loads). In many parts of this watershed, year round occupancy is increasing, so the lbs of nitrogen per unit will increase as well.
As noted above, the average nitrogen concentration discharged from the wastewater facility between January 2007 and December 2009 was 4.88 ppm. If the average residential water use on septic system (currently 134.5 gpd), and this water is directed to the wastewater facility instead, the annual nitrogen loading to the estuary would be 1.80 lbs. In other words, for every septic system in the 0% attenuation zone that is sewered, loading to the estuary would decline 7.88 lbs (9.68-1.80).
Total annual nitrogen load from the wastewater facility declined until about 2008, but is now increasing as new properties are connected to the expanding sewer network. A confounding factor in the analysis is that the MEP has previously used annual load, but the water quality impacts of the facility occur primarily during warmer months, hence the reason why the facility has nitrogen limits only for eight months of the year. An alternative loading approach might be to estimate loading only for this 8-month period, and extrapolate the loading to an annual estimate. This approach, however, is not used by the MEP in their TMDL analysis, and would require a seasonal analysis of watershed loading as well, because estuary loading is high in the winter than in the summer because of increased river and groundwater flow, and decreased biological attenuation.
Embayment area, bathymetry, and tidal range
This data was developed in the 1990s by the Buzzards Bay NEP.
| Embayment | Water area km2 | mean depth at MLW (m) | mean depth (m) at Half Tide | Vol. at MLW m3x10^6 | Vol. at Half Tide m3x10^6 | Tidal Range(m) |
| Wareham River | 2.49 | 0.96 | 1.56 | 2.4 | 3.89 | 1.2 |
BBNEP GIS Data and Loading Spreadsheet
Parcels (joined to assessors, sewer account, and water account data): wre_parc_27sep10.zip
BBNEP December 2009 protected open space coverage: bbnep_openspace_dec09.zip (factored into the parcel coverage with some modifications).
Wareham River watershed: war_riv_1shed_jun10.shp.zip
Subwatersheds: warriv_subw_16jul10.zip (includes draft attenuation coefficients)
EOT Road Impervious: wre_massgis_imperv_in_eot_rds_may2010.zip
Parcel Impervious: wre_none_rd_imperv_areas_may2010.zip
MassGIS 2005 Landuse: landuse2005_wre_dissolve.zip (used by the BBNEP to calculate golf, and agriculture, except cranberry)
Cranberry Bog Coverage: cranberry_bogs_wre_ac.zip a simplified cranberry bog growing area coverage used in this analysis
BBNEP Cranberry Bog Coverage: cranberry_bogs_semass_ac.zip a simplified Southeast Mass cranberry bog growing area coverage derived from DEP’s MassGIS WCP coverage (slightly different than above).
Please review this loading spreadsheet that was used for this webpage: bbnep_nload_wre_1dec2010.xlsx
Links to more information
Massachusetts Estuaries Project page for the Wareham River
August 2, 2010 letter to the BBC on expected sewering).
Buzzards Bay Coalition: Interactive WQ Maps
Coalition Leads Effort to Find Community Solutions to Nitrogen Issue
Buzzards Bay Coalition Agawam River (and other area) Water Quality Trends, 1993-2003
Buzzards Bay Coalition Baywatchers III poster
Buzzards Bay Coalition Baywatchers 1992-2005 Water Quality Atlas
BB NEP’s Wareham page (includes past correspondence on nitrogen loading issues)
Buzzards Bay landfill sites 2007 DEP MassGIS data as a Google Earth File; click on polygon for more info
Mass DEP’s page on the Massachusetts Estuaries Project
Please report errors or send comments about this page to Joe Costa.