Status & Trends
Related Pages: Tracking Town Actions |
General Bay-wide Trends (2023 status and data with 2022 scores from the last State of the Bay report)
| Category | Recent Trend | State of Bay Status* | Comments | Link for Graph | Link for Info |
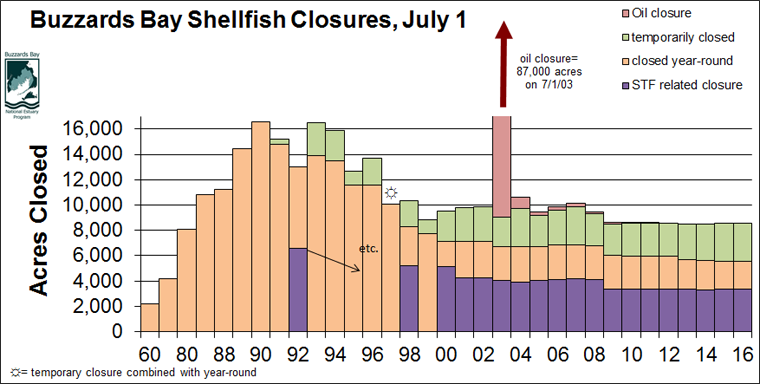
| Shellfish Closures | 59 | In the past five years there was a 2000 acre increase in July 1 shellfish bed closures, with much of the loss due to implementing closures in harbors and boat anchorage areas to comply with changed FDA rules. |  | Shellfish Closure Status | |
| Embayment Eutrophication | 57 | Perhaps partly due to some dry summers, and some pollution reduction efforts, nitrogen pollution indicators showed dramatic improvements. |  | CBB website | |
| Eelgrass Beds | 25 | Due to improvements in water transparency and a large expansion of eelgrass in West Branch of the Westport River, with an abundance not seen since the 1980s, the eelgrass score for Buzzards Bay ticked up two points since the last Coalition State of Buzzards Bay report. |  | Eelgrass page | |
| Herring Runs | 1 | The population rebound of 2010 to 2014 leveled off and during 2021 to 2023, most runs are at their lowest levels in decades. |  | Herring Runs page | |
| Scallops | 2 | While bay scallop catch varies considerably from year to year, the downward decline continues to dramatically fall. |  | BBC State of Bay | |
| Endangered Roseate Terns | NA | The total number of pairs of nesting Roseate Terns in Buzzards Bay has shown a dramatic improvement during the past nine years. Restoration activities of Bird Island and Ram Island, funded by both the New Bedford PCB Trustees, and the Bouchard oil spill trustees likely were key to the surge in breeding pairs by 2021 and 2022. |  | MA Wildlife 2022 Roseate Tern report | |
| Protected Open Space | NA | The towns, supported by the work of the Buzzards Bay Coalition and area lands trusts have kept land and habitat protection moving forward, but at a slow pace. | 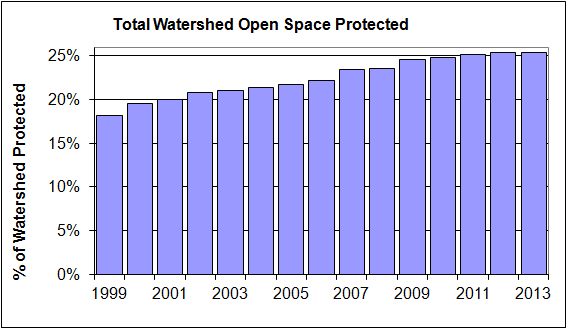 | Open Space Page | |
| CCMP Progress | NA | With the CCMP updated in 2013, we are no longer tracking recommendations in the old document. This page and other information will be used to track progress. |  | GPRA Report | |
| Salt Marshes Restored | NA | Slow steady progress. This indicator is not included in the basket score. | 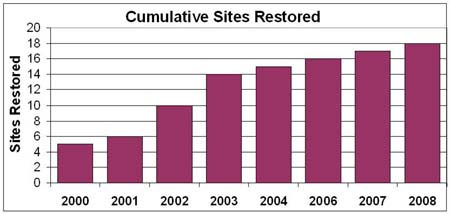 | Salt Marsh Atlas Page | |
| Remaining Wetlands | 59 | Coalition’s Assessment of Remaining Wetlands in the BB Watershed (*) | NA | BBC State of Bay | |
| Remaining Forest | 76 | Coalition’s Assessment of Remaining Forest in the BB Watershed (*) | NA | BBC State of Bay | |
| Remaining Stream Buffers | 71 | Coalition’s Assessment of Remaining Stream Buffers in the BB Watershed (*) | NA | BBC State of Bay | |
| BBP Trend Basket | 1 | NA | Current average of BBP Recent Trend scores (2 to -2) |  | NA |
(*) Status based on historic conditions or the remaining percentage compared to hypothesized pre-European settlement conditions as described in The Buzzards Bay Coalition’s 2003 BBC State of the Bay Report.
Climate Trends
Graph of average water temperature in Woods Hole, MA during the first two weeks of August when water temperatures are typically the warmest.
EPA National Estuary Program 2007 Coastal Conditions Report

EPA and Congress Celebrate NEP 20th anniversary, but Nation’s estuaries remain impaired.
On June 5, 2007, representatives of Congress, EPA, and national estuary programs around the country met in Washington DC to celebrate 20 years of success in the National Estuary Program (NEP). The NEP was established by the 1987 rewrite of the Clean Water Act, and has served as a model for watershed and estuary protection efforts around the country. A major focus of many of the NEPs and their partners during the past few years are their efforts to protect and restore wetlands, with more than 1 million acres protected or restored during the past 6 years. Since 2003, the NEPs have also leveraged well over 1 billion dollars to fund and implement various environmental protection and restoration efforts. Around the country, the NEPs have been strong advocates in facilitating the adoption of EPA’s stormwater control program and Total Maximum Daily Load controls for nutrients and other pollutants.
Despite these positive achievements, the news is not all good. At the same meeting, EPA released its National Estuary Program National Coastal Condition Report (Go to EPA’s NEP CCR page to download the report). The report was based on data collected between 1999 and 2003. The NEP estuaries were rated individually, regionally, and nationally using four primary indicators of estuarine condition: water quality, sediment quality, benthic (bottom) condition, and fish-tissue contaminant concentrations. In this report, EPA acknowledges that in NEP bays, many of the measures of habitat and water quality showed poor conditions. These conditions appear to reflect impacts from the tremendous growth in coastal development and population that these bay watersheds experienced, coupled with inadequate controls of pollution. Still, EPA stated in their press release that the NEPs were doing somewhat better than their corresponding coastal regions in response to growth pressures. They noted: “While population pressures in the NEPs were greater than those in the non-NEP estuaries from 1990-2000, the NEP estuaries showed the same estuarine conditions as, or better than, other coastal waters overall. By 2000, more than two-thirds of the coastal population lived in NEP counties, which comprise less than six percent of the coastal land area.”
The report section on Buzzards Bay ranked it at the high end of “fair”, although in the case of certain contaminants, like toxic contaminants in fish, the bay ranked as “poor.” The report was meant be an evaluation of the entire bay by averaging the results of stations both in the central bay and in representative embayments. A weakness of this approach is that overall, conditions in central Buzzards Bay tend to be very good, but many of the bays and harbors around the bay are impacted from pollutant inputs and changes in habitat cause by development and other changes in land use. The report notes: “Buzzards Bay has avoided many estuary-wide problems that plague other watersheds around the country, but land-use practices and the growing local population have impacted natural resources in the 32 small embayments in the Buzzards Bay area.”
It is for this reason that the Buzzards Bay Coalition, with financial support of our program and the Commonwealth, monitors and tracks water quality in more than 30 Buzzards Bay embayments.
Read the Buzzards Bay section of the report (a 1.8 MB pdf file).
