Wetland Losses in the Buzzards Bay Watershed
Wetland loss sites in the Buzzards Bay watershed identified by comparing circa 1993 to circa 2000 photographs.
Recent court rulings limiting federal jurisdiction regulating fill and discharges to wetlands
In 2001, in a decision in the case of Solid Waste Agency of Northern Cook County (SWANCC) versus the U. S. Army Corps of Engineers, the U. S. Supreme Court limited the scope of the Clean Water Act’s jurisdiction by limiting the definition of “Waters of the United States” In the SWANCC decision, the Court invalidated the “Migratory Bird Rule” (the use of the wetlands by migratory birds crossing state lines) as the sole basis for applying federal wetland regulations to “isolated” and non-navigable waters and wetlands. The court’s decision did not define which waters and wetlands were covered by federal regulations (33 CFR 328(a)(3)).
In 2004, the U.S. Environmental Protection Agency and the U.S. Army Corps of Engineers proposed, but did not adopt, new rules defining “Waters of the United States” to address this decision. The impacts on states of this ruling and the lack of clear new rules, is discussed by Christie and Hausmann (2003).
While the SWANCC decision eliminated isolated wetlands from federal protection, it did not directly affect adjacent or bordering vegetated wetlands along navigable waters of the U.S. However, in 2006, federal jurisdiction was further limited by the Supreme Court decision in Rapanos versus the United States. In one sense, Rapanos went beyond the idea of just “navigable waters” as being waters of the U.S. by including the concept of pollutant path-ways. However, the Supreme Court also rejected the concept that all bordering wetlands at all distances from navigable waters, or connected by any means, should be automatically included under the jurisdiction of the Army Corps, and remanded the case back for review. That is, questionable cases will need to be decided on a case-by-case basis until the law and regulations are clarified.
Because of the Rapanos decision, new cases are making their way to the Supreme Court to further clarify the definition of jurisdictional wetlands under the Clean Water Act. In a local case, a Carver, MA cranberry grower (Johnson Limited Partnership) appealed a $75,000 fine and a $1.1 million restoration cost (read the US EPA press release) for destroying 50 acres of wetlands to build a cranberry bog. The grower asserted that the Army Corps had no jurisdiction over the destroyed wetlands. In 2005, the US First District judge rejected this assertion. However, in October 2006, the first U.S. Circuit Court of Appeals sent the case back to U.S. District Judge for further consideration in light of the Rapanos decision. In June 2007, the US EPA and Army Corps issued new guidance on the definition of waters of the United States.
Because the authority of the federal government in protecting wetlands has diminished in recent years, two actions should occur. First, the U.S. Congress should clarify the language and intent of the Clean Water Act to protect wetlands. Second, state and local government should adopt laws necessary to protect the values and functions of wetlands from discharges and fill where jurisdiction is lost by federal agencies. While Massachusetts is in a better position than most states to protect wetlands under state and local laws, the Massachusetts Wetland Protection Act does little to protect isolated wetlands, and only a quarter of municipalities in the Buzzards Bay watershed have adopted local bylaws to protect isolated wetlands.
Wetland Losses in the Buzzards Bay Watershed
In Massachusetts, federal, state, and municipal laws protect wetlands, which includes both surface waters and vegetated and non-vegetated areas where soils are wet. These laws generally protect wetlands and wetland resources, and prevent inadvertent wetland losses. However, at all levels of government, there is a process for allowing the filling of wetlands under certain circumstances. If wetlands are permitted to be filled or destroyed, the regulatory agencies generally require the creation of new wetlands, or restoration of damaged wetlands, as mitigation of these permitted losses.
More problematic than permitted wetland losses is the illegal or illicit destruction of wetlands. The most egregious cases of wetland losses occur when someone intentionally destroys a wetland without seeking a permit, hoping to surreptitiously fill a wetland without anyone noticing. Smaller wetland areas are sometimes destroyed because of the property owner’s lack of understanding of the law or recognition of wetland habitat on their property.
A third cause of wetland loss occurs when local officials (Conservation Commissions), who are charged with enforcing state law, fail to understand the laws or the definition of wetlands that they supposed to protect. An extreme example of wetland loss caused by poor local enforcement is described on our Holly Woods Wetland Case page.
When violation of these laws and supporting regulations occur, enforcement of the law could theoretically be enforced simultaneously at different levels of government, but generally local and state regulators defer to and coordinate with federal agencies like the US EPA and Army Corps in cases involving very large wetland violations.
Tracking Large Wetland Losses
In 1993, the Massachusetts Department of Environmental Protection began mapping wetlands in Massachusetts using aerial photographs. In 2000, when they began updating these maps, they began to notice changes in wetlands such as fillings and alterations. While such activities can be permitted under state, federal, and municipal laws and regulations, it soon became apparent that some large wetland alterations had occurred in the 7 year period that never received permit approval from government regulators.
In 2003, DEP began systematically analyzing the discrepancies in the two wetland mapping coverages, and began criminal investigations on some of the more notable alterations. In 2003, DEP announced that it would be using this approach in a systematic way to pursue criminal violations of the state’s Wetland Protection Act. The announcement about the program can be read in the newspaper article below.
Link to Article in the Christian Science Monitor
New Bedford Standard Time Article: June 2, 2005 – DEP fines cranberry growers
While DEP is continuing its investigations on larger illegal alterations around the state, at the same time they have begun preparing maps of wetland alterations for each municipality. In June 2004, The Town of Rochester was the first town to receive these maps. These maps will enable local Conservation Commission officials to investigate cases in their own jurisdiction. The DEP has now analyzed 210 Commonwealth municipalities in this way.
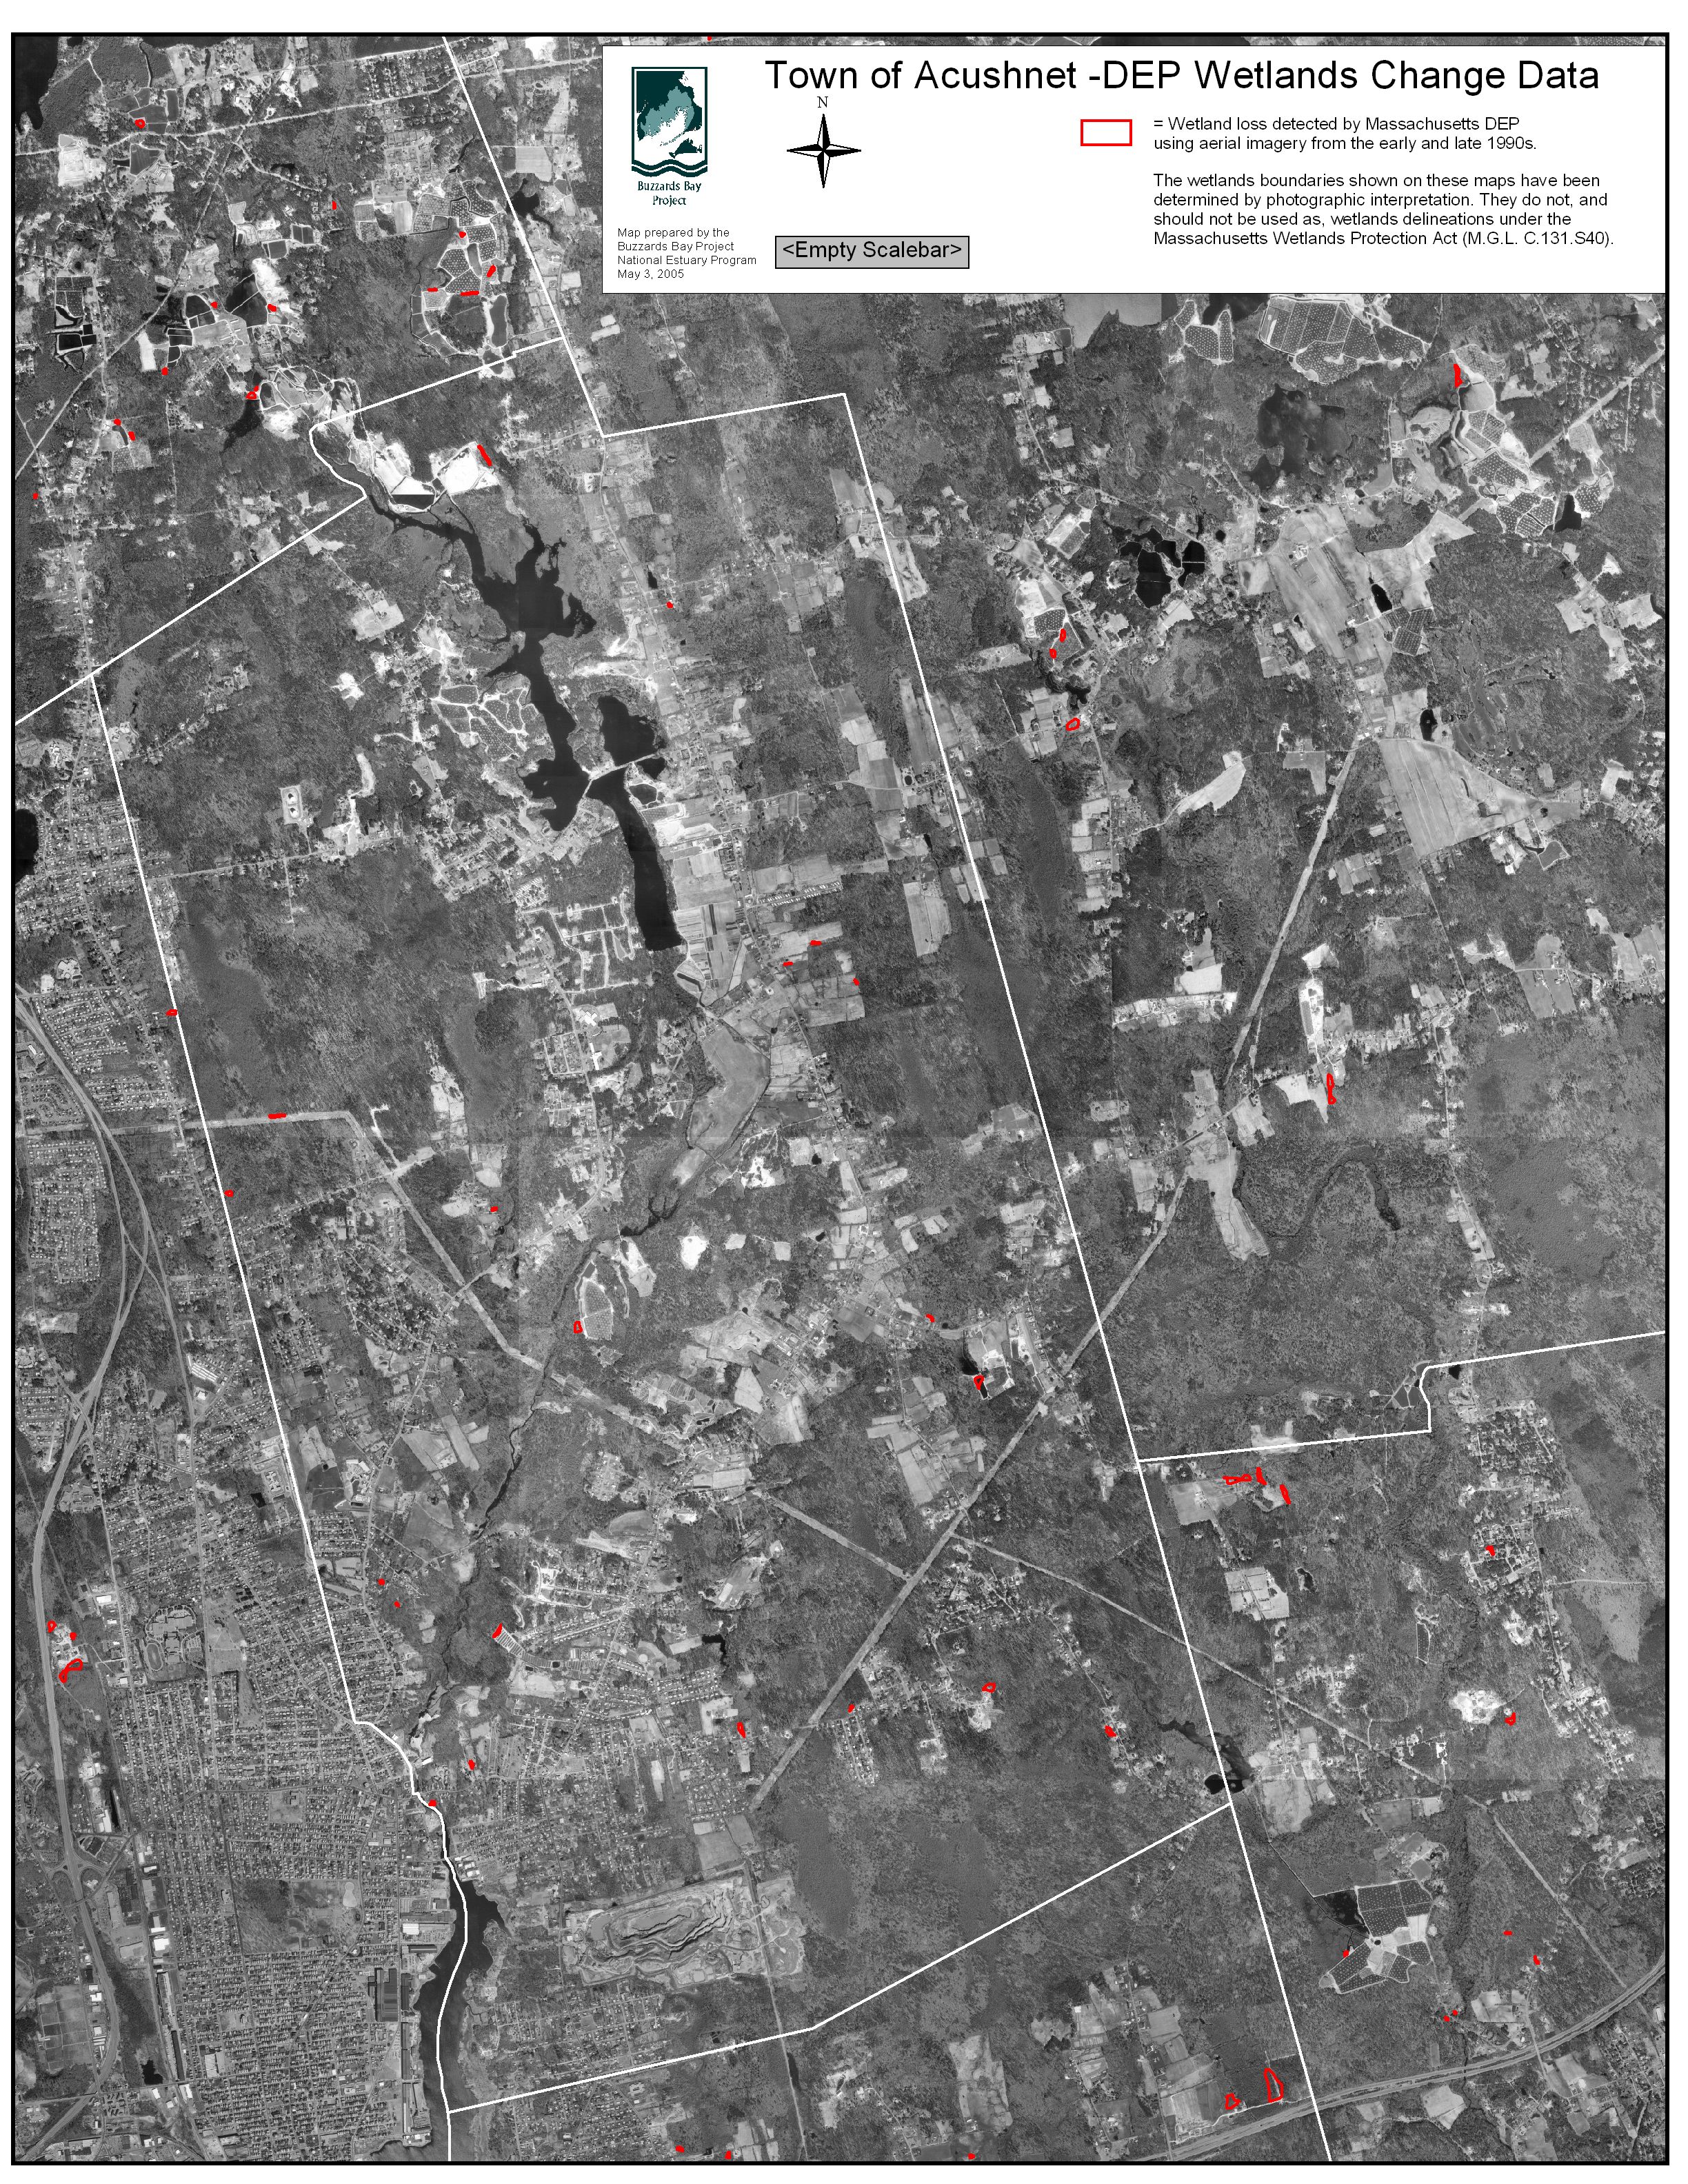
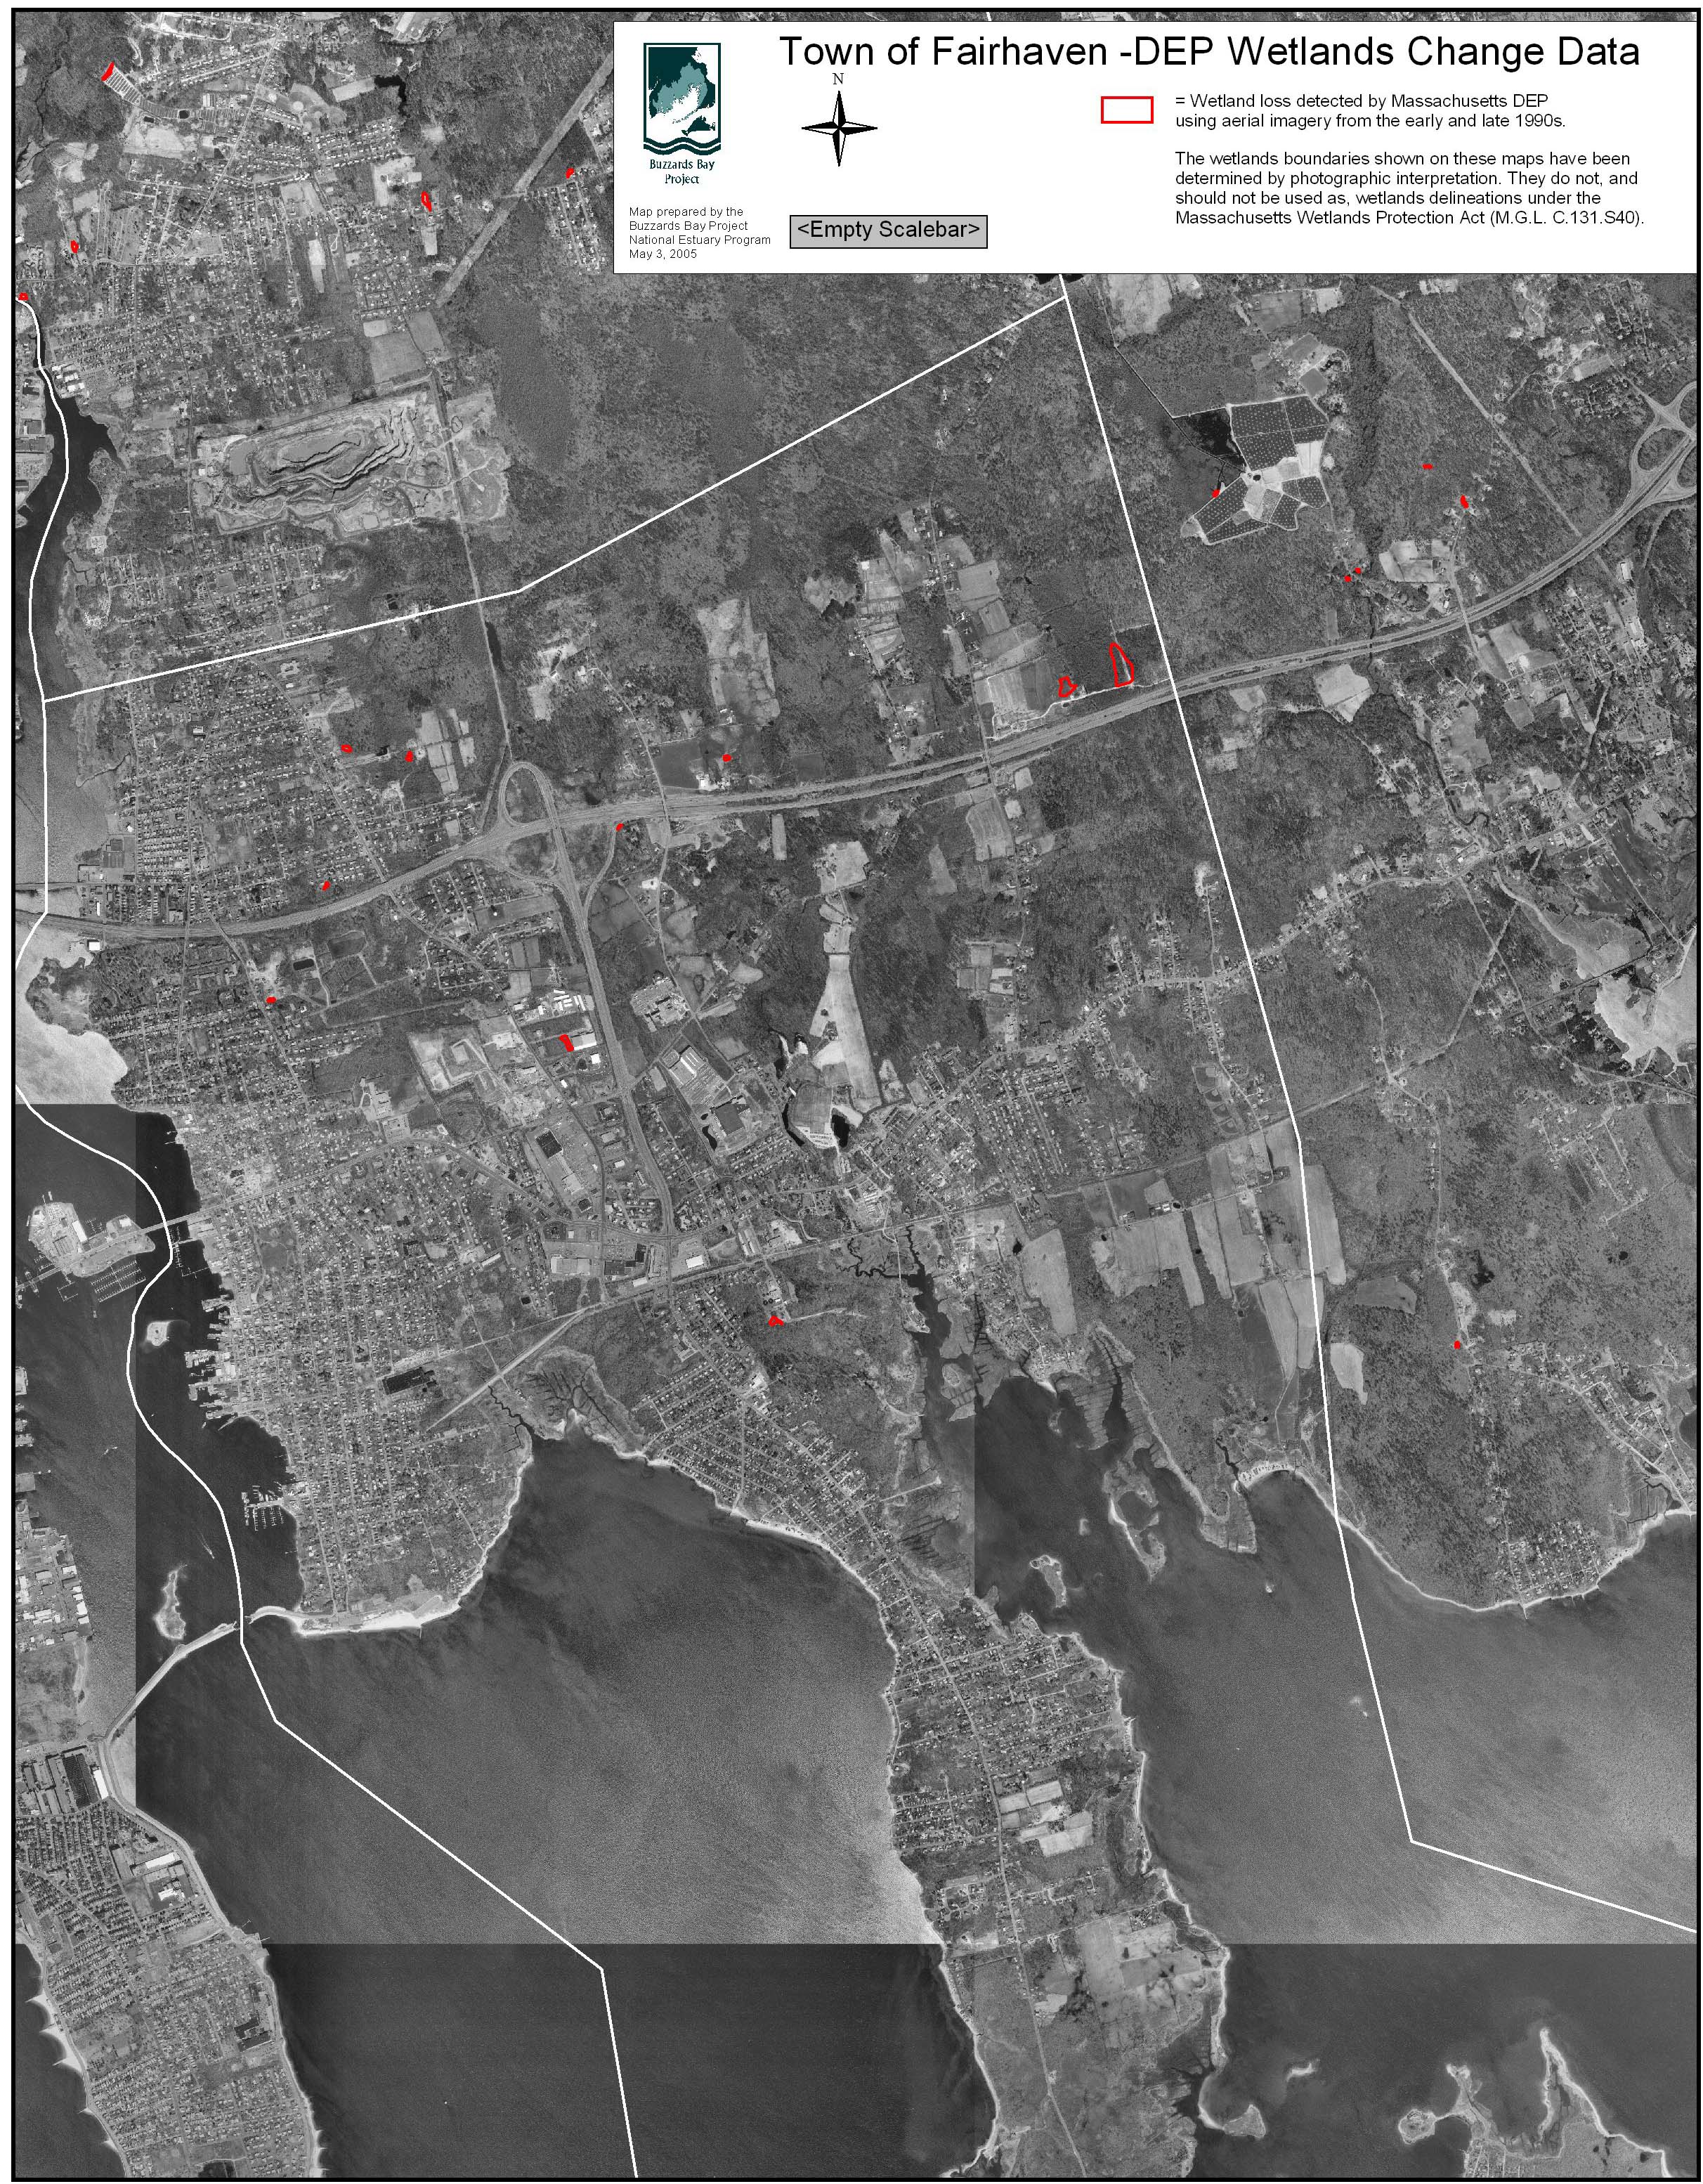
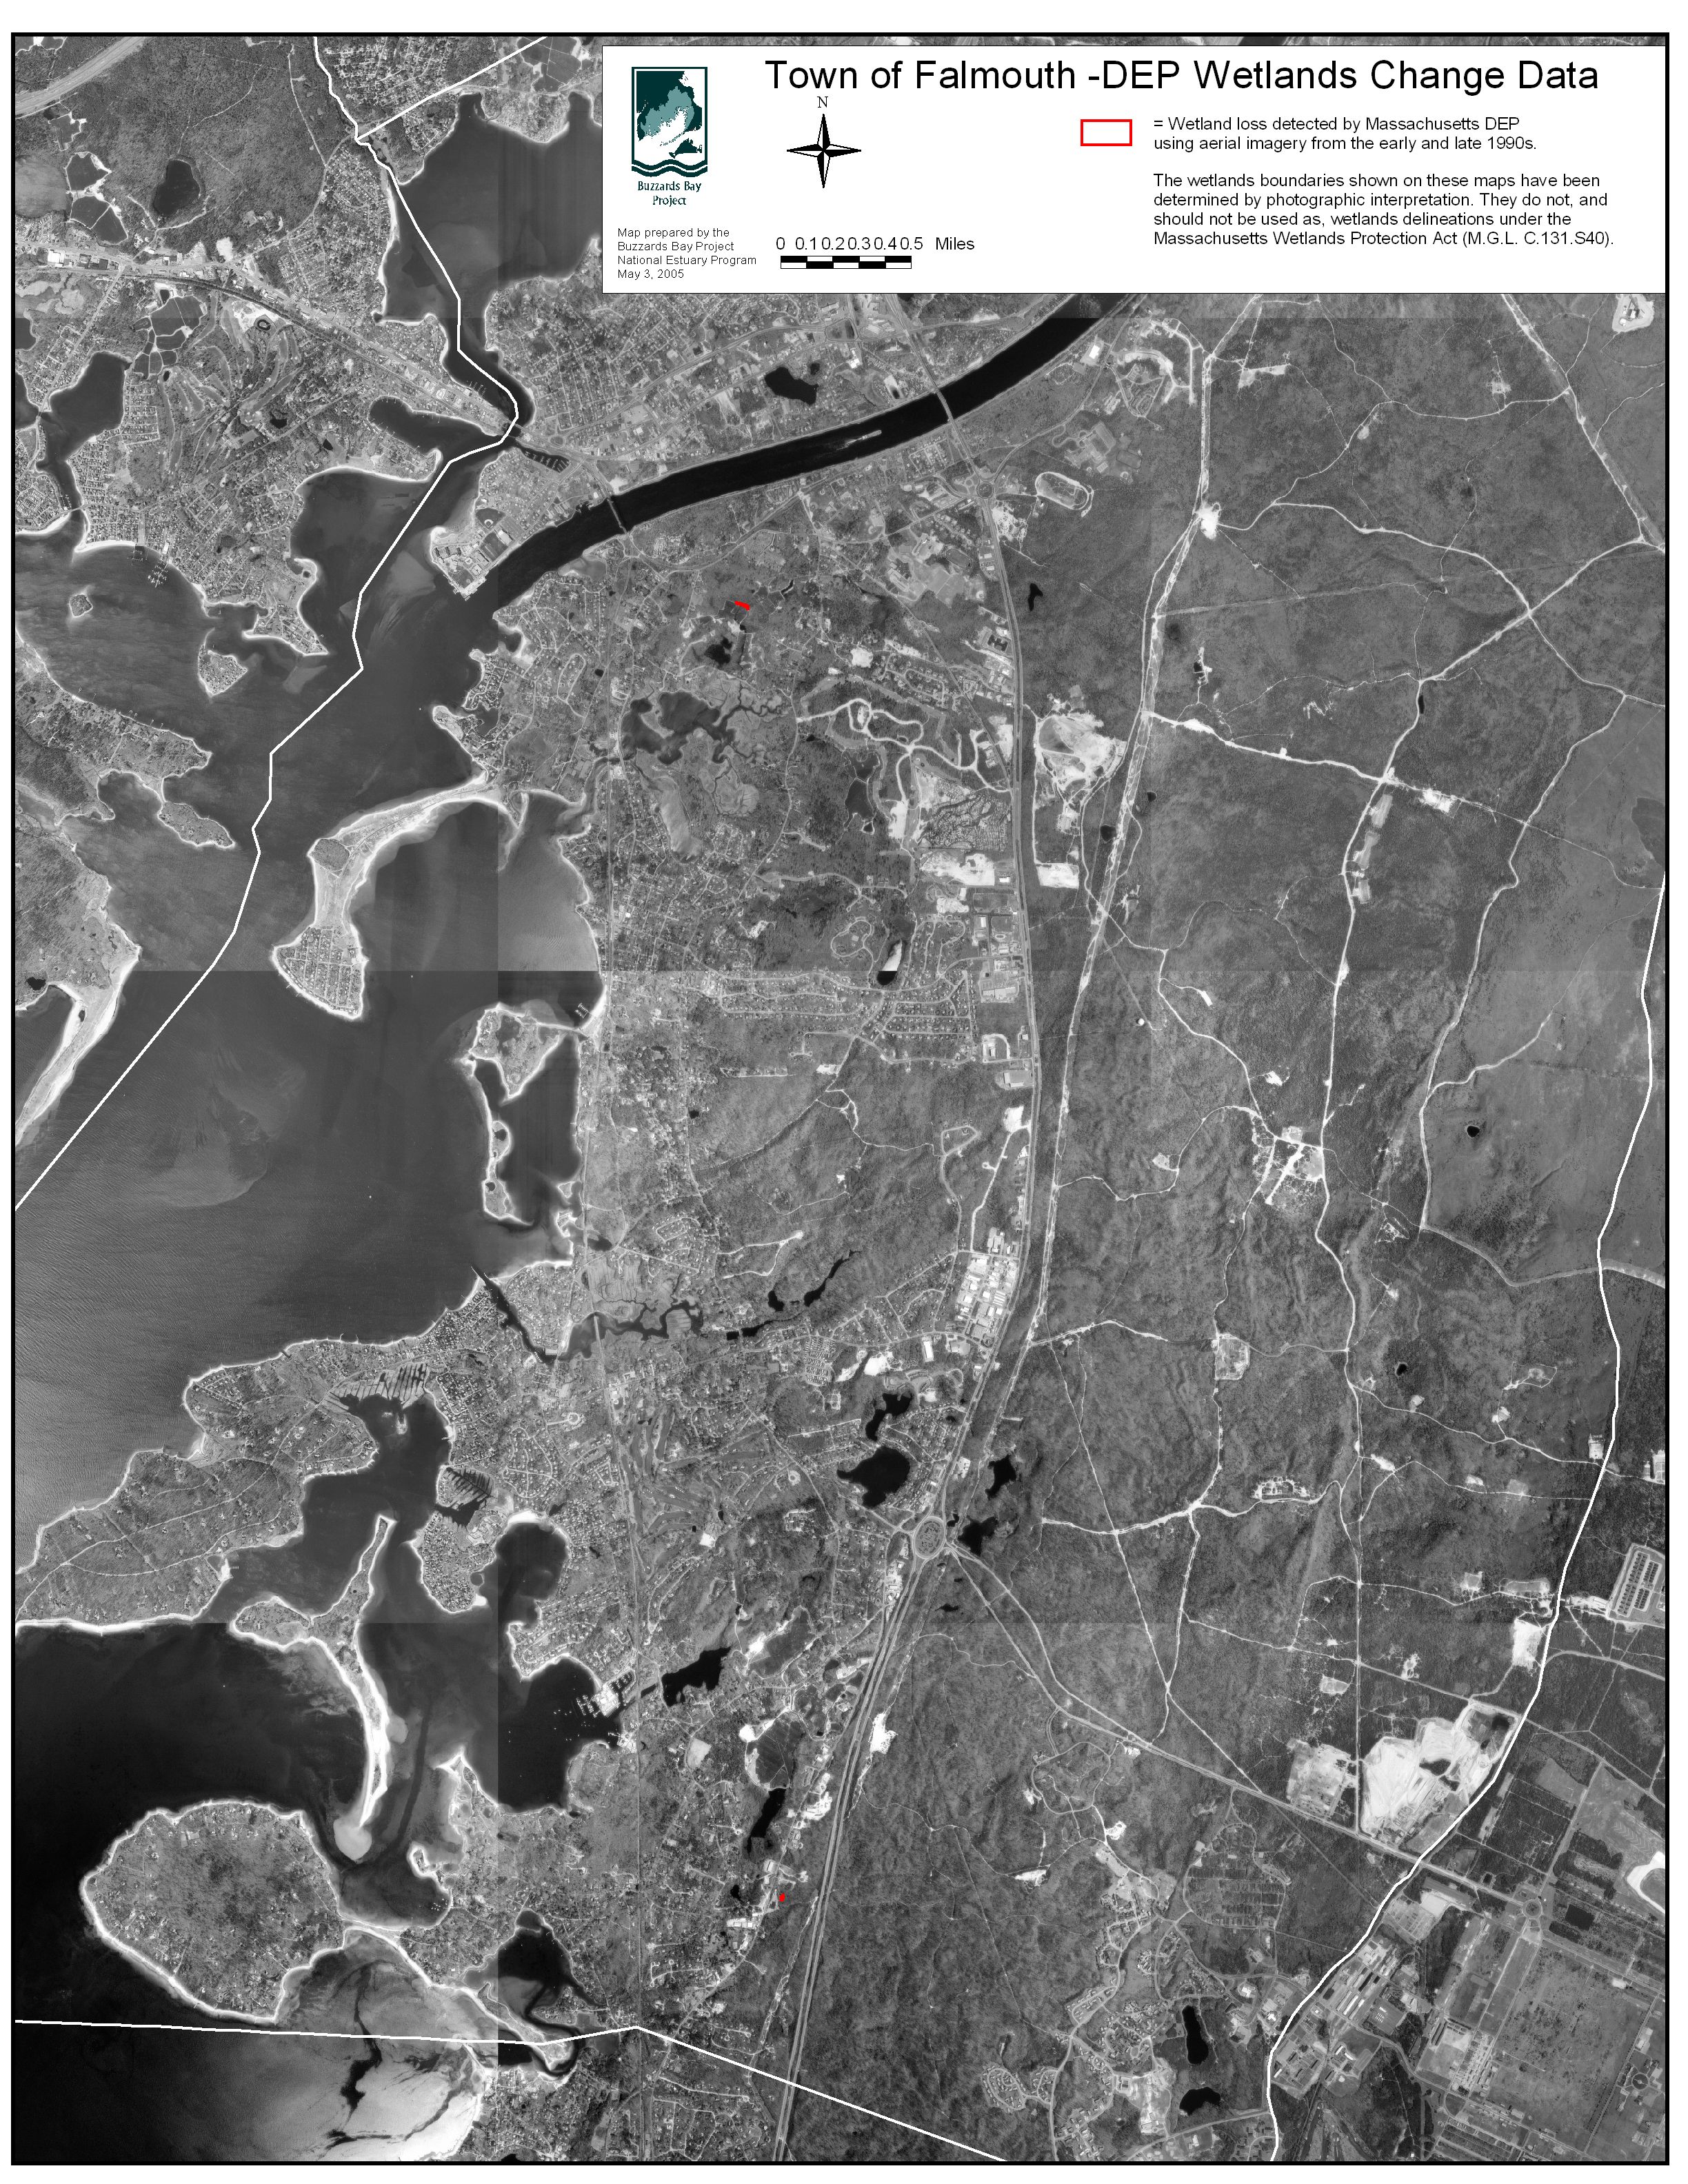
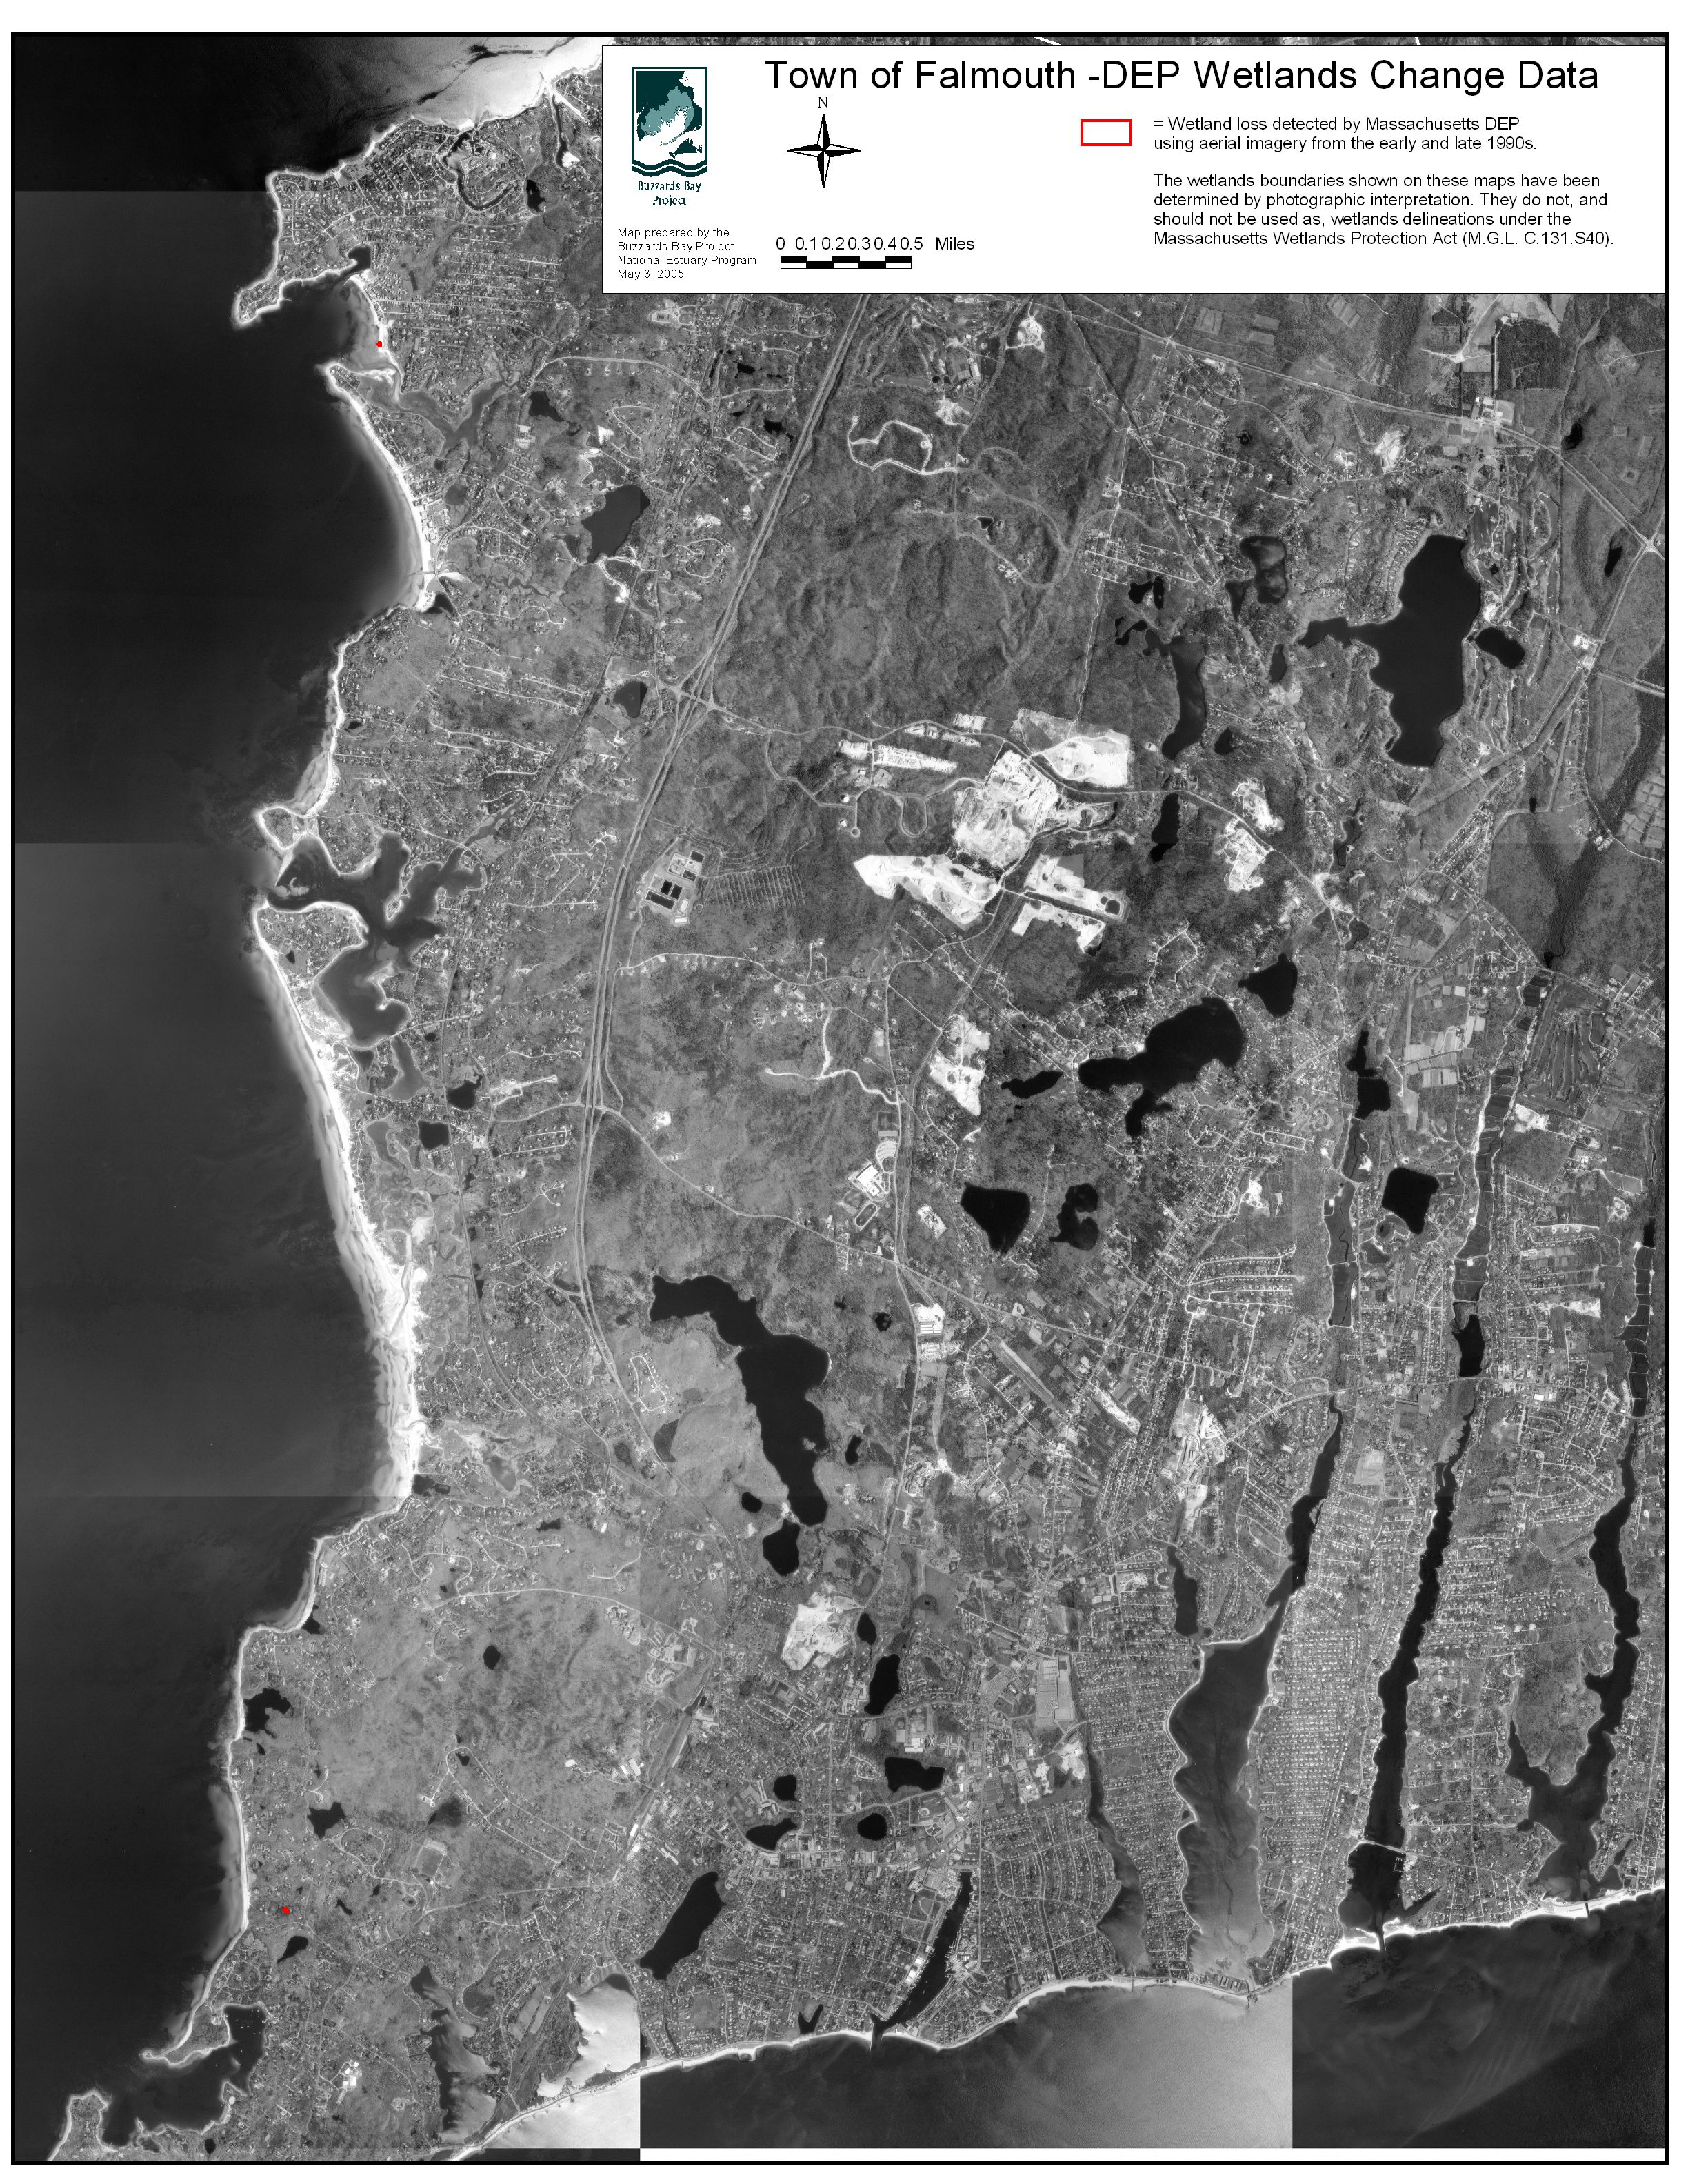
The wetland change maps were created in an automated way, using computer software to document changes in mapped wetland coverage. It is important to recognize not all alterations identified by the DEP study are illegal activities. Some wetland loss was the result of legal actions sanctioned by state and local permits. Some of the mapped wetland losses were artifacts of human error of interpretation, or minor errors in the mapping of wetland boundaries. Other losses, however, will likely be the result of unpermitted activity, and may result in criminal prosecutions by state or federal agencies.
The process of documenting wetland loss using aerial photographs will omit most wetland losses less than 4000 square feet. Thus the DEP surveys do not include the many smaller incremental wetland infringements that may be occurring in the watershed that could cumulatively account for additional undocumented wetland losses.
Buzzards Bay Overview
Below is an overview map showing the locations of lost wetlands that were documented by DEP as of 2011, and some before and after pictures shown below are of those sites. Detailed maps of altered wetland sites were originally sent to all Buzzards Bay area Conservation Commissions for the first time in 2004.
Find new wetland losses with Google Earth
These interactive map files show DEP core wetlands evident from aerial photographs. Actual wetland areas exceed the mapped areas, but these maps are very useful for planning, evaluating wetlands on undeveloped parcels, and for documenting legal and illegal wetland alterations. These files are quite large so we recommend downloading them to a specific directory on your computer (right click on the link, then save to a new directory e.g. “googleearth”), then opening them with Google Earth.
If you do not have Google earth downloaded on your computer, we recommend you install this free program is you want to use some of the geographic data sets we provide on our site.
Download Google Earth now to display the maps below.
Wetlands in western Buzzards Bay watershed
Tip: In Google Earth, right click on the wetlands kmz file and change the properties of the fill so that the wetland areas are 50 percent transparent or more. Start with the 2007 aerial photographs. If you see structures or roads in mapped wetlands, “turn back the clock” by clicking the clock icon in Google Earth to see different photographs going back to 1991. If you see something that does not seem right, save and print the images and send them to your local conservation commission.
View also this Google Earth kmz file of DEP’s Wetland Change areas released in 2003.
Please note in the map above, data for the towns of Middleborough and Acushnet were not obtained from DEP. However, most of the sites in Acushnet are likely included in the map above, because data sets provided to each town included nearby areas in surrounding communities. In Middleborough, only losses near the town of Carver are shown.
The distribution of total acreage loss documented by town is shown in the tables below.
| Town | No. of Sites | Acres Lost |
| Carver | 48 | 36.4 |
| Middleborough | 52 | 33.7 |
| Rochester | 56 | 26.8 |
| Dartmouth | 42 | 11.5 |
| Mattapoisett | 22 | 11.3 |
| Wareham | 18 | 10.8 |
| New Bedford | 14 | 8.2 |
| Marion | 14 | 6.9 |
| Fairhaven | 10 | 5.2 |
| Westport | 28 | 4.9 |
| Plymouth | 15 | 4.5 |
| Acushnet | 20 | 4.0 |
| Bourne | 5 | 2.4 |
| Falmouth | 2 | 0.2 |
| Gosnold | 0 | 0.0 |
Several important conclusions can be made from this table. First, even though only 1/3 of Middleborough is included in the data set we studied, it came in a close second among the towns for total acres lost. This suggests that the greatest wetland loss among Buzzards Bay watershed towns likely occurred in Middleborough.
Why is wetland loss greater in some communities than others? One important reason is that some towns, like Bourne and Falmouth have very few wetlands as compared to other towns, especially in the northwest portion of the watershed. This is illustrated in the map below.
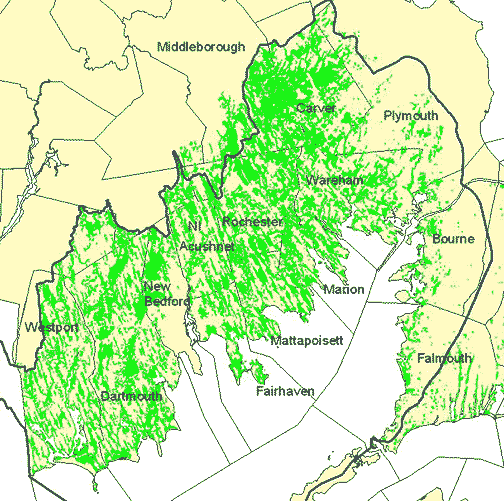
Distribution of wetlands in the Buzzards Bay watershed.
Another important reason for the uneven distribution of wetland loss in Buzzards Bay watershed municipalities is due to the causes of the wetland loss. As shown by the pie-chart below, most acreage of wetland loss was due to cranberry bog activity and expansion, accounting for 61% of the wetland acres lost in the region. As shown by the map at the bottom of this page, most cranberry bogs in the watershed are found in the Towns of Carver, Middleborough, and Wareham.
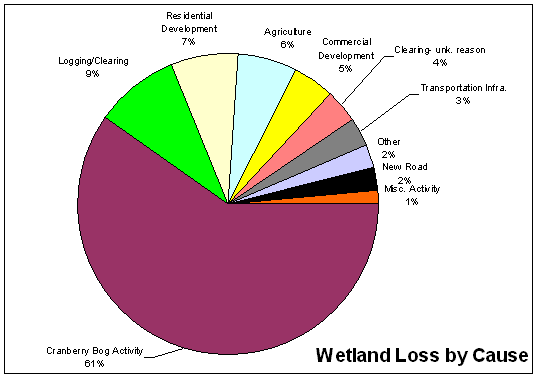
Causes of wetland loss in the Buzzards Bay watershed as a percentage of total acres lost between 1993 and 2000. Since DEP began documenting wetland loss using aerial photography, there has been a dramatic decline of wetland losses as a result of cranberry bog activity. This is documented on DEP’s web page Principal causes of wetland loss identified.
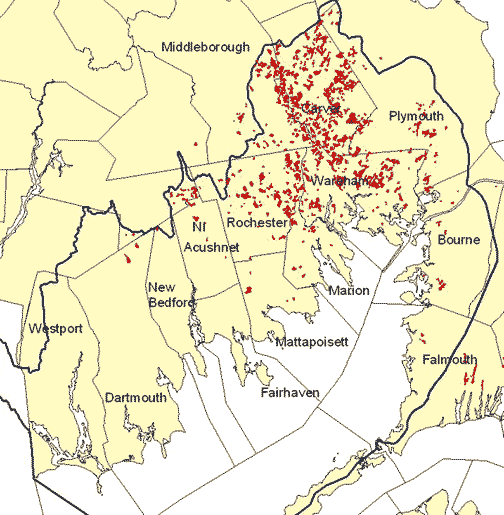
Distribution of Cranberry Bogs in the Buzzards Bay watershed. Not all bogs outside the watershed are shown. To learn more, go to our page about cranberry bogs in the Buzzards Bay watershed.
Besides the extent of wetlands and cranberry bogs in a town, many other factors can explain the variations in wetland losses among communities, including rates of population growth, road construction, and even the capacity and interest of local environmental officials to identify and correct wetland violations.
Finally, it is important to recognize that some of these losses of wetlands occurred legally, with the proper environmental permits. However, many losses have also occurred illegally. Information about some wetland loss enforcement cases can be found in the links at the bottom of the page.
Buzzards Bay Watershed Examples
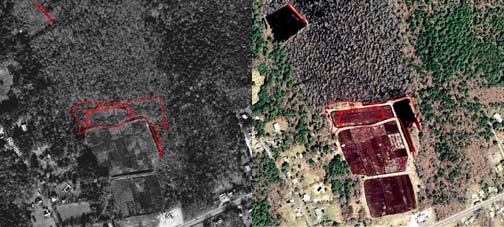
This wooded wetland near a bog along Route 6 in Mattapoisett shows conversion of wetlands into a bog, fill in wetlands, and clear cut and excavation of a shrub wetlands into a irrigation pond.
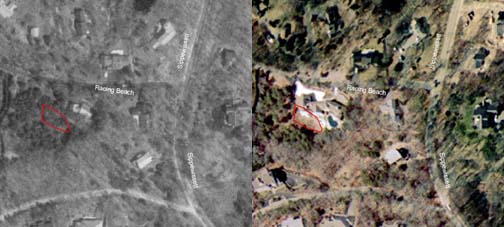
This wooded swamp near Racing Beach in Falmouth shows clearing and fill.
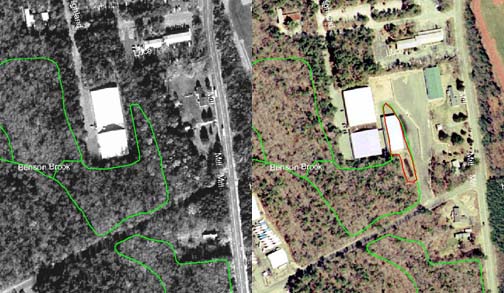
This wooded swamp off Mill Street in Marion shows clearing, fill, and construction in a wetland.
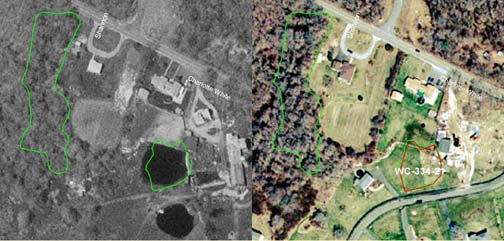
These deep marshes in Westport near Charlotte White Road were filled in for homes and lawns.
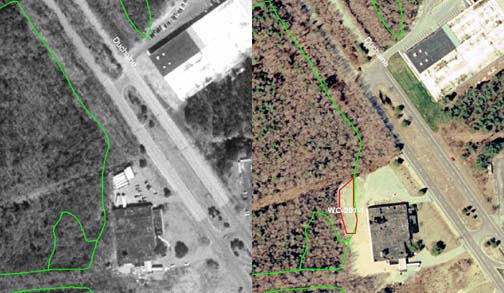
These 2 homes off Rt. 6 near Old Rochester Regional High in Mattapoisett were built in a wooded swamp.
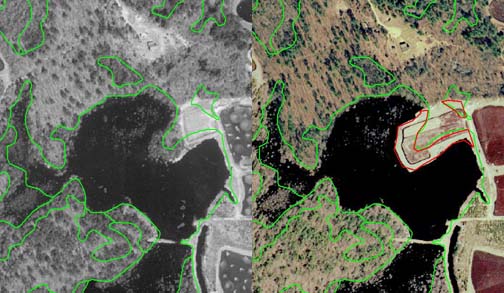
This cranberry bog was expanded into a pond and bordering wetland in the Town of Carver.
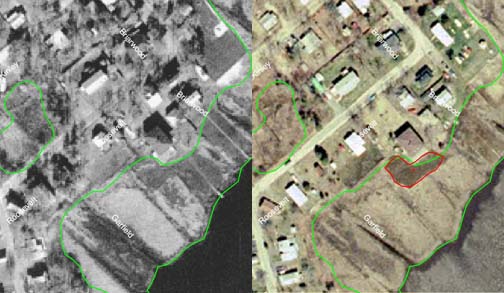
This salt marsh behind a home in Wareham was turned into a lawn.
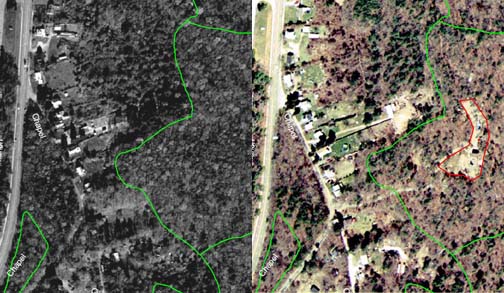
A portion of this wooded swamp was filled to make a new subdivision.
A portion of this wooded swamp was filled the expansion of a parking lot.
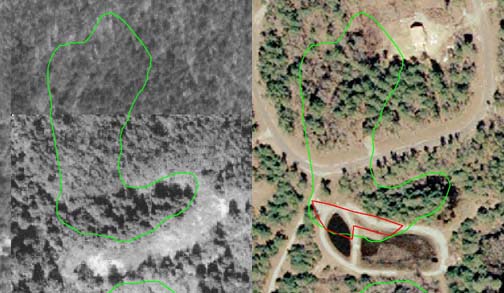
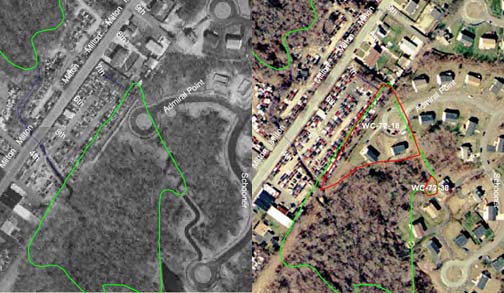
This wooded swamp north of Hiller Street in in a subdivision off Walnut Plain Rd. in Mattapoisett shows clearing, filled for roads, and possibly a new cranberry bog.
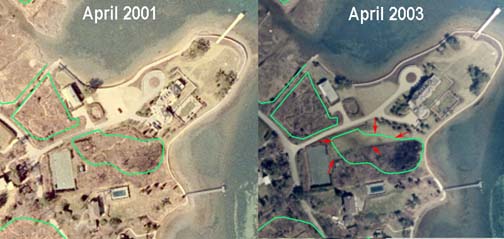
Roughly 10,000 square feet of wetland on Penzance Point was cleared to create a lawn on an estate on Penzance Point Road in Woods Hole in Falmouth. Read the Falmouth Enterprise article on this case.
Buzzards Bay Watershed Wetland Loss Maps
We have produced these more detailed overview maps of Buzzards Bay wetlands losses. They are 2 MB jpg aerial pictures that open in another window. You can move the image to the detail you wish to examine.
Town of Wareham Wetland Loss Map
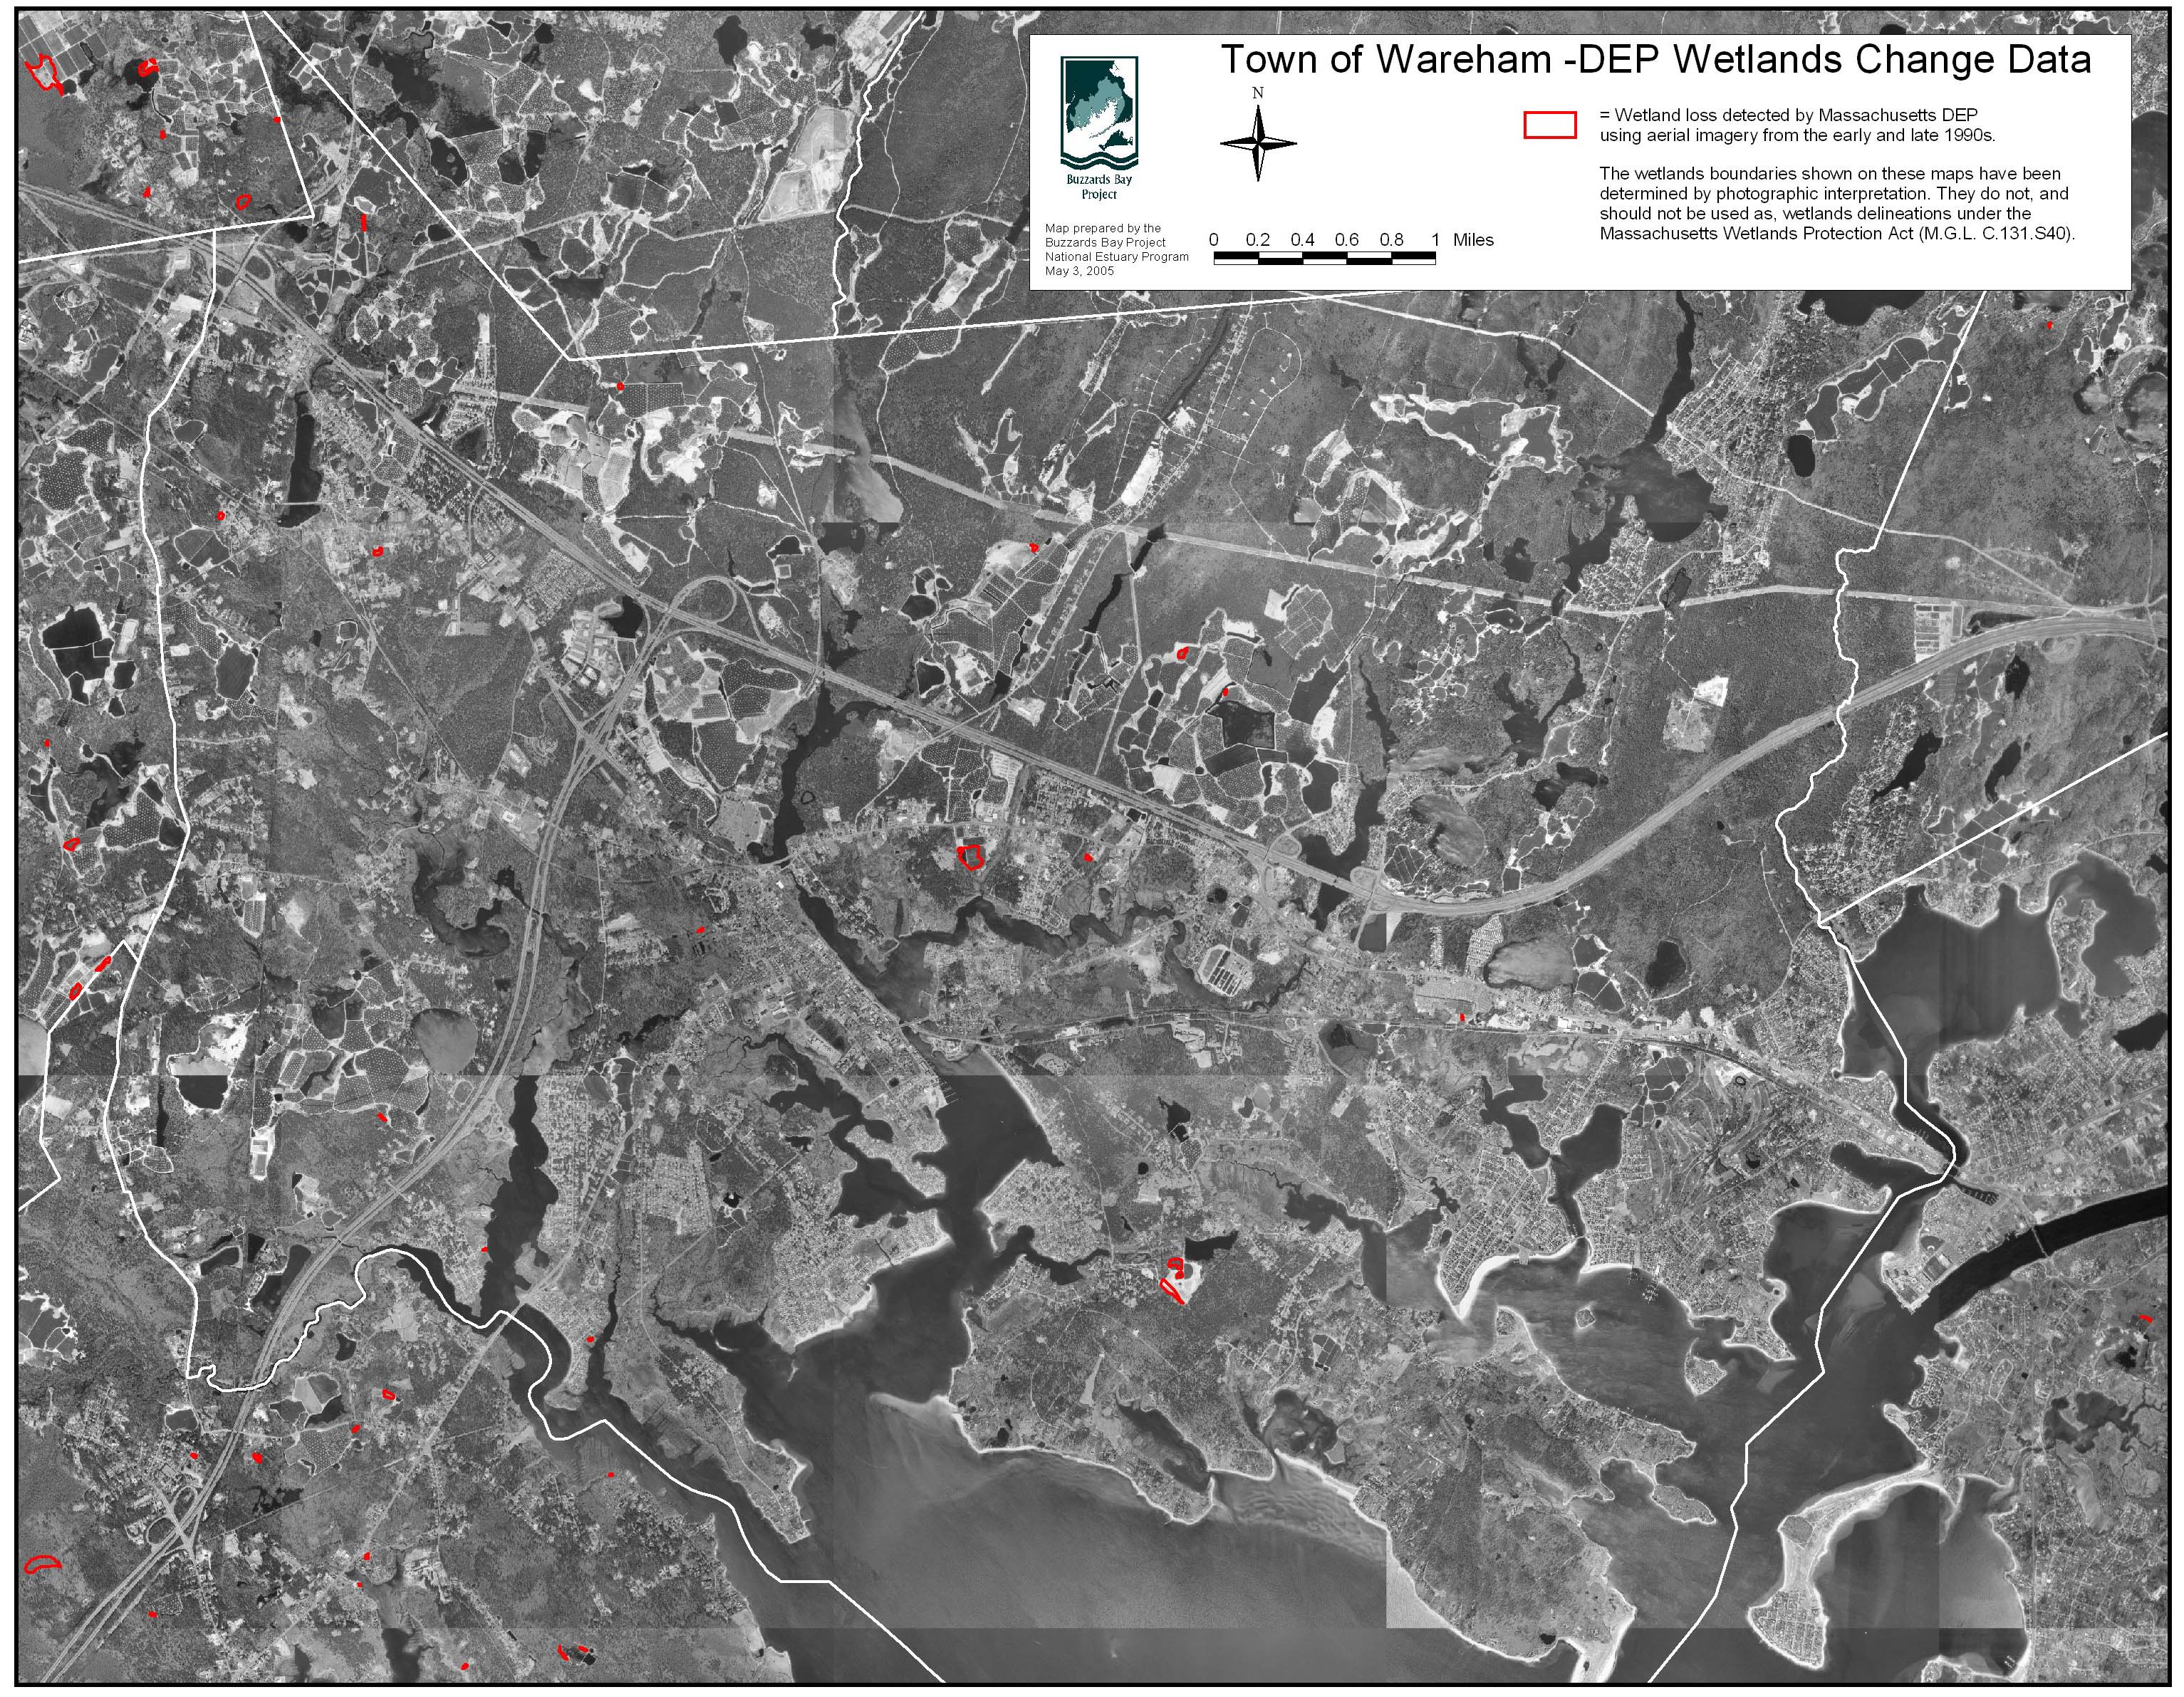
Town of Marion Wetland Loss Map
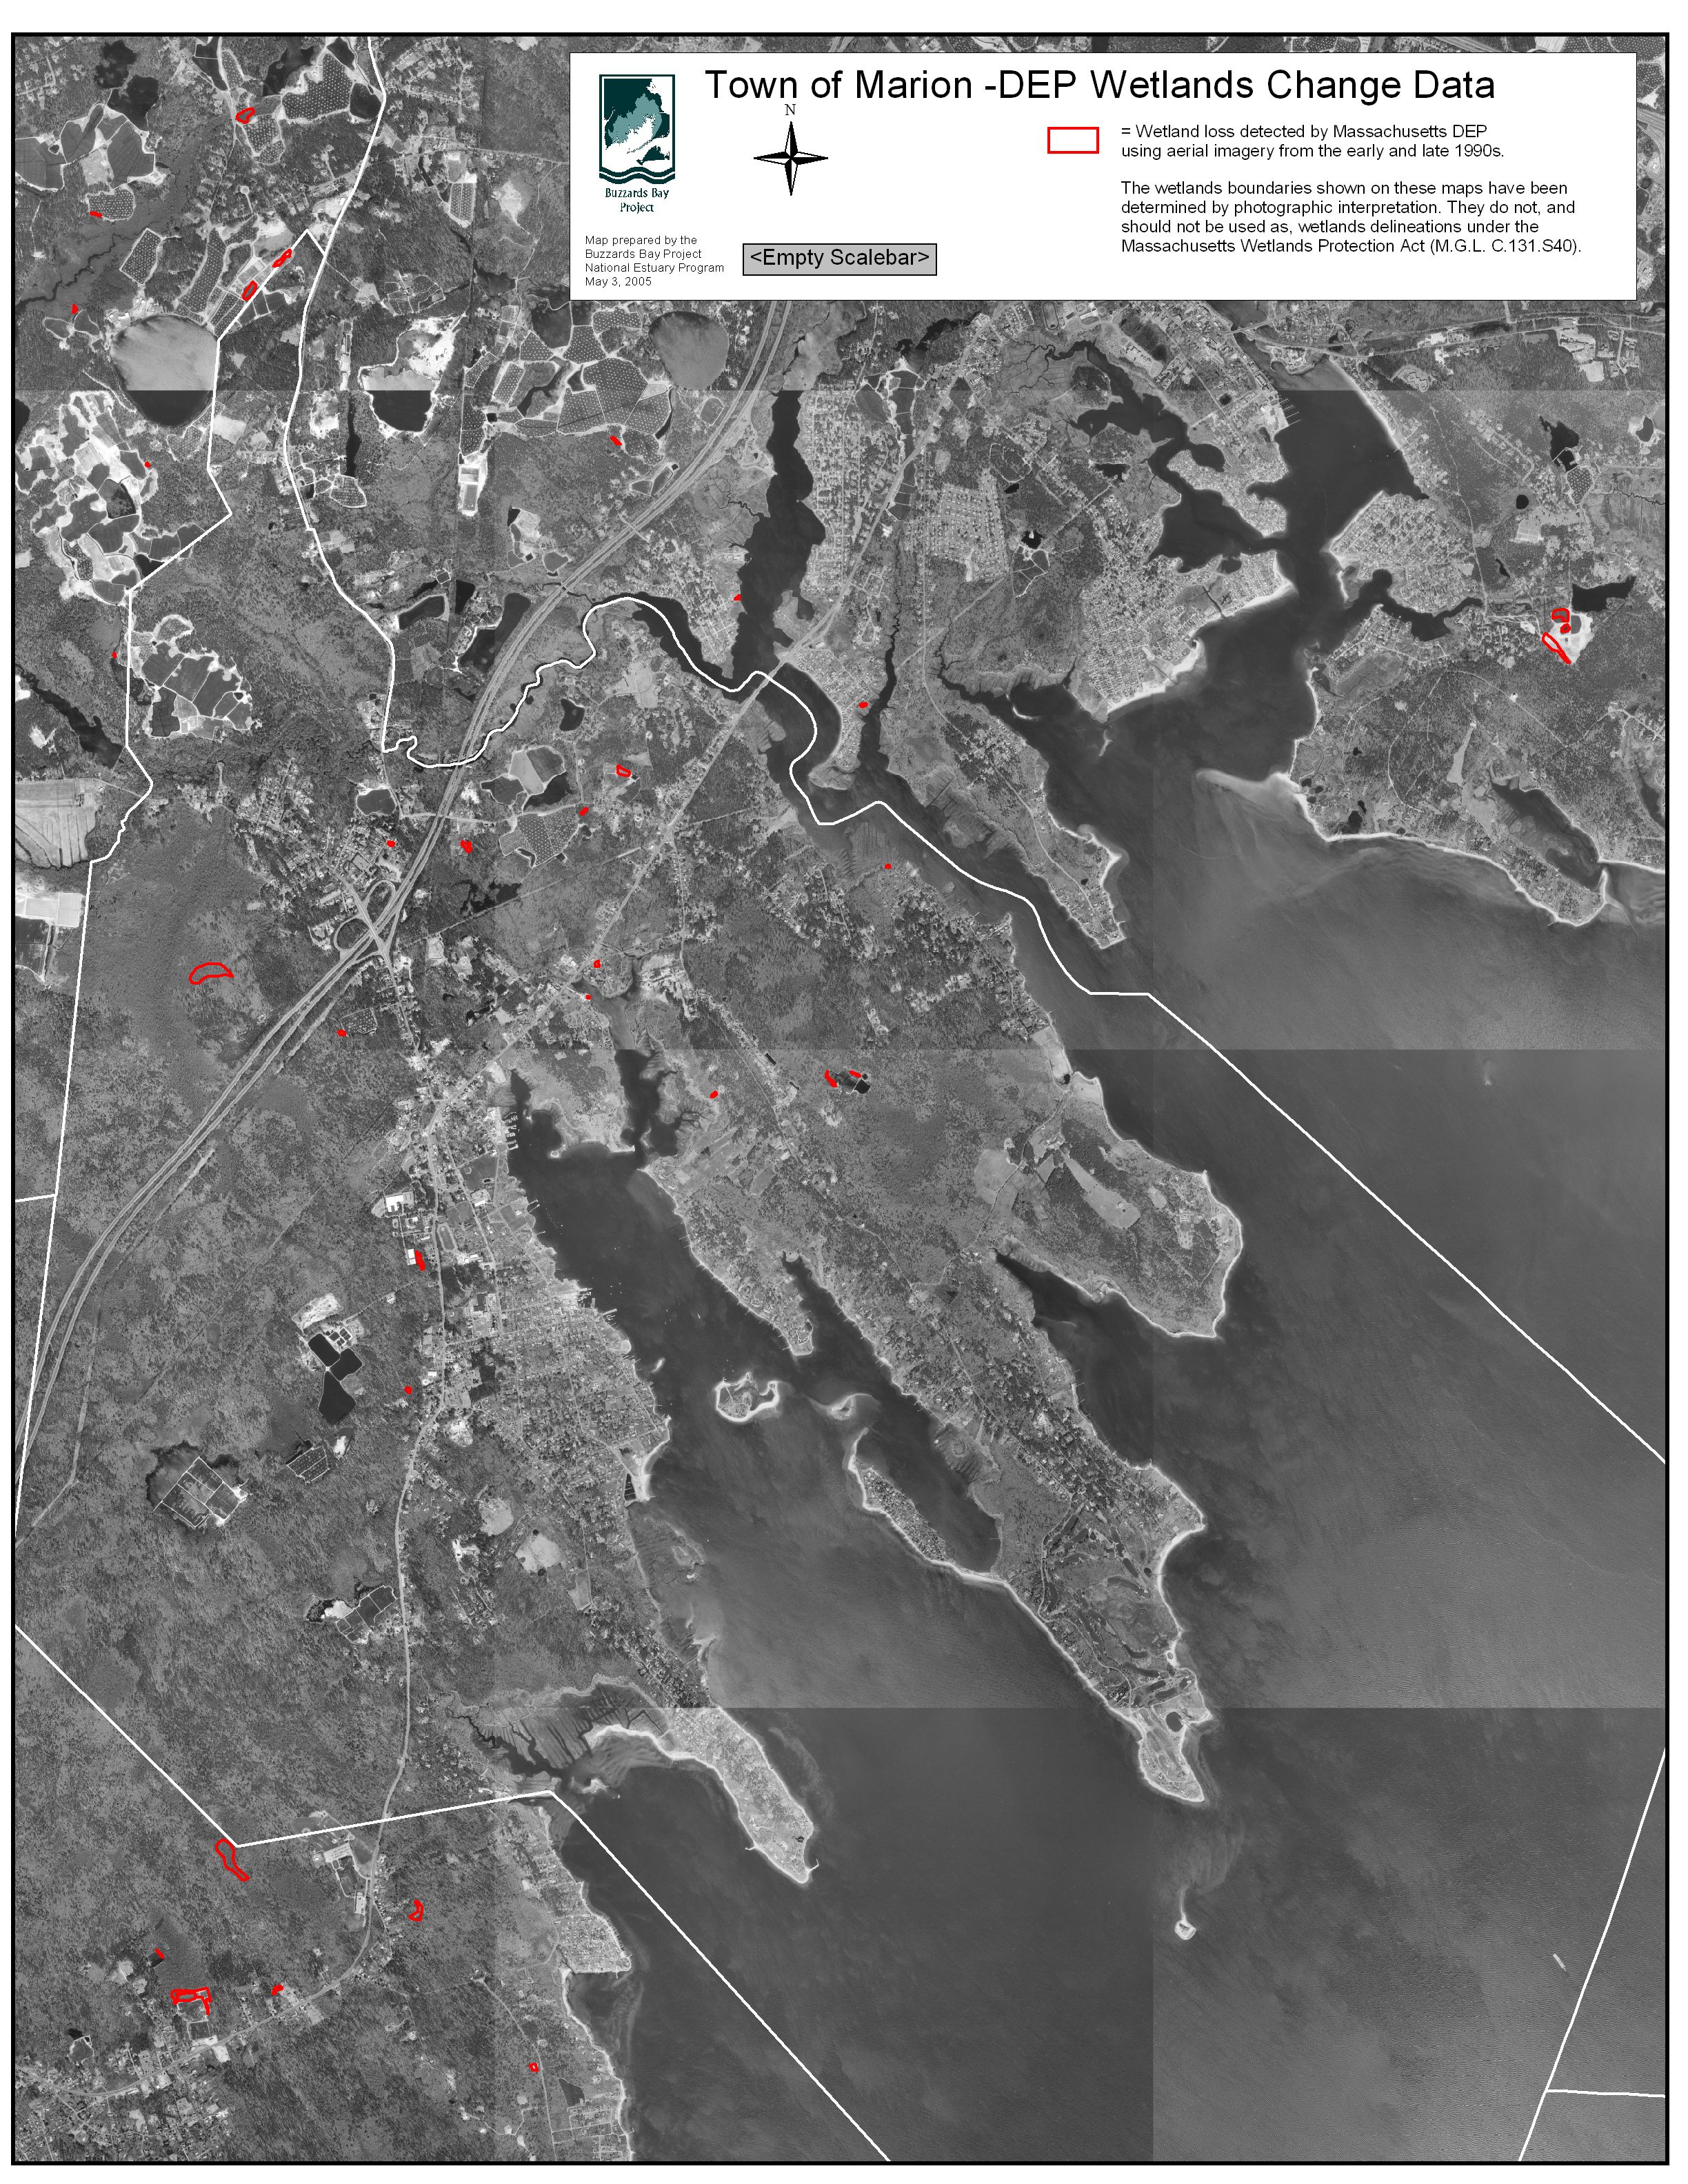
Town of Mattapoisett Wetland Loss Map
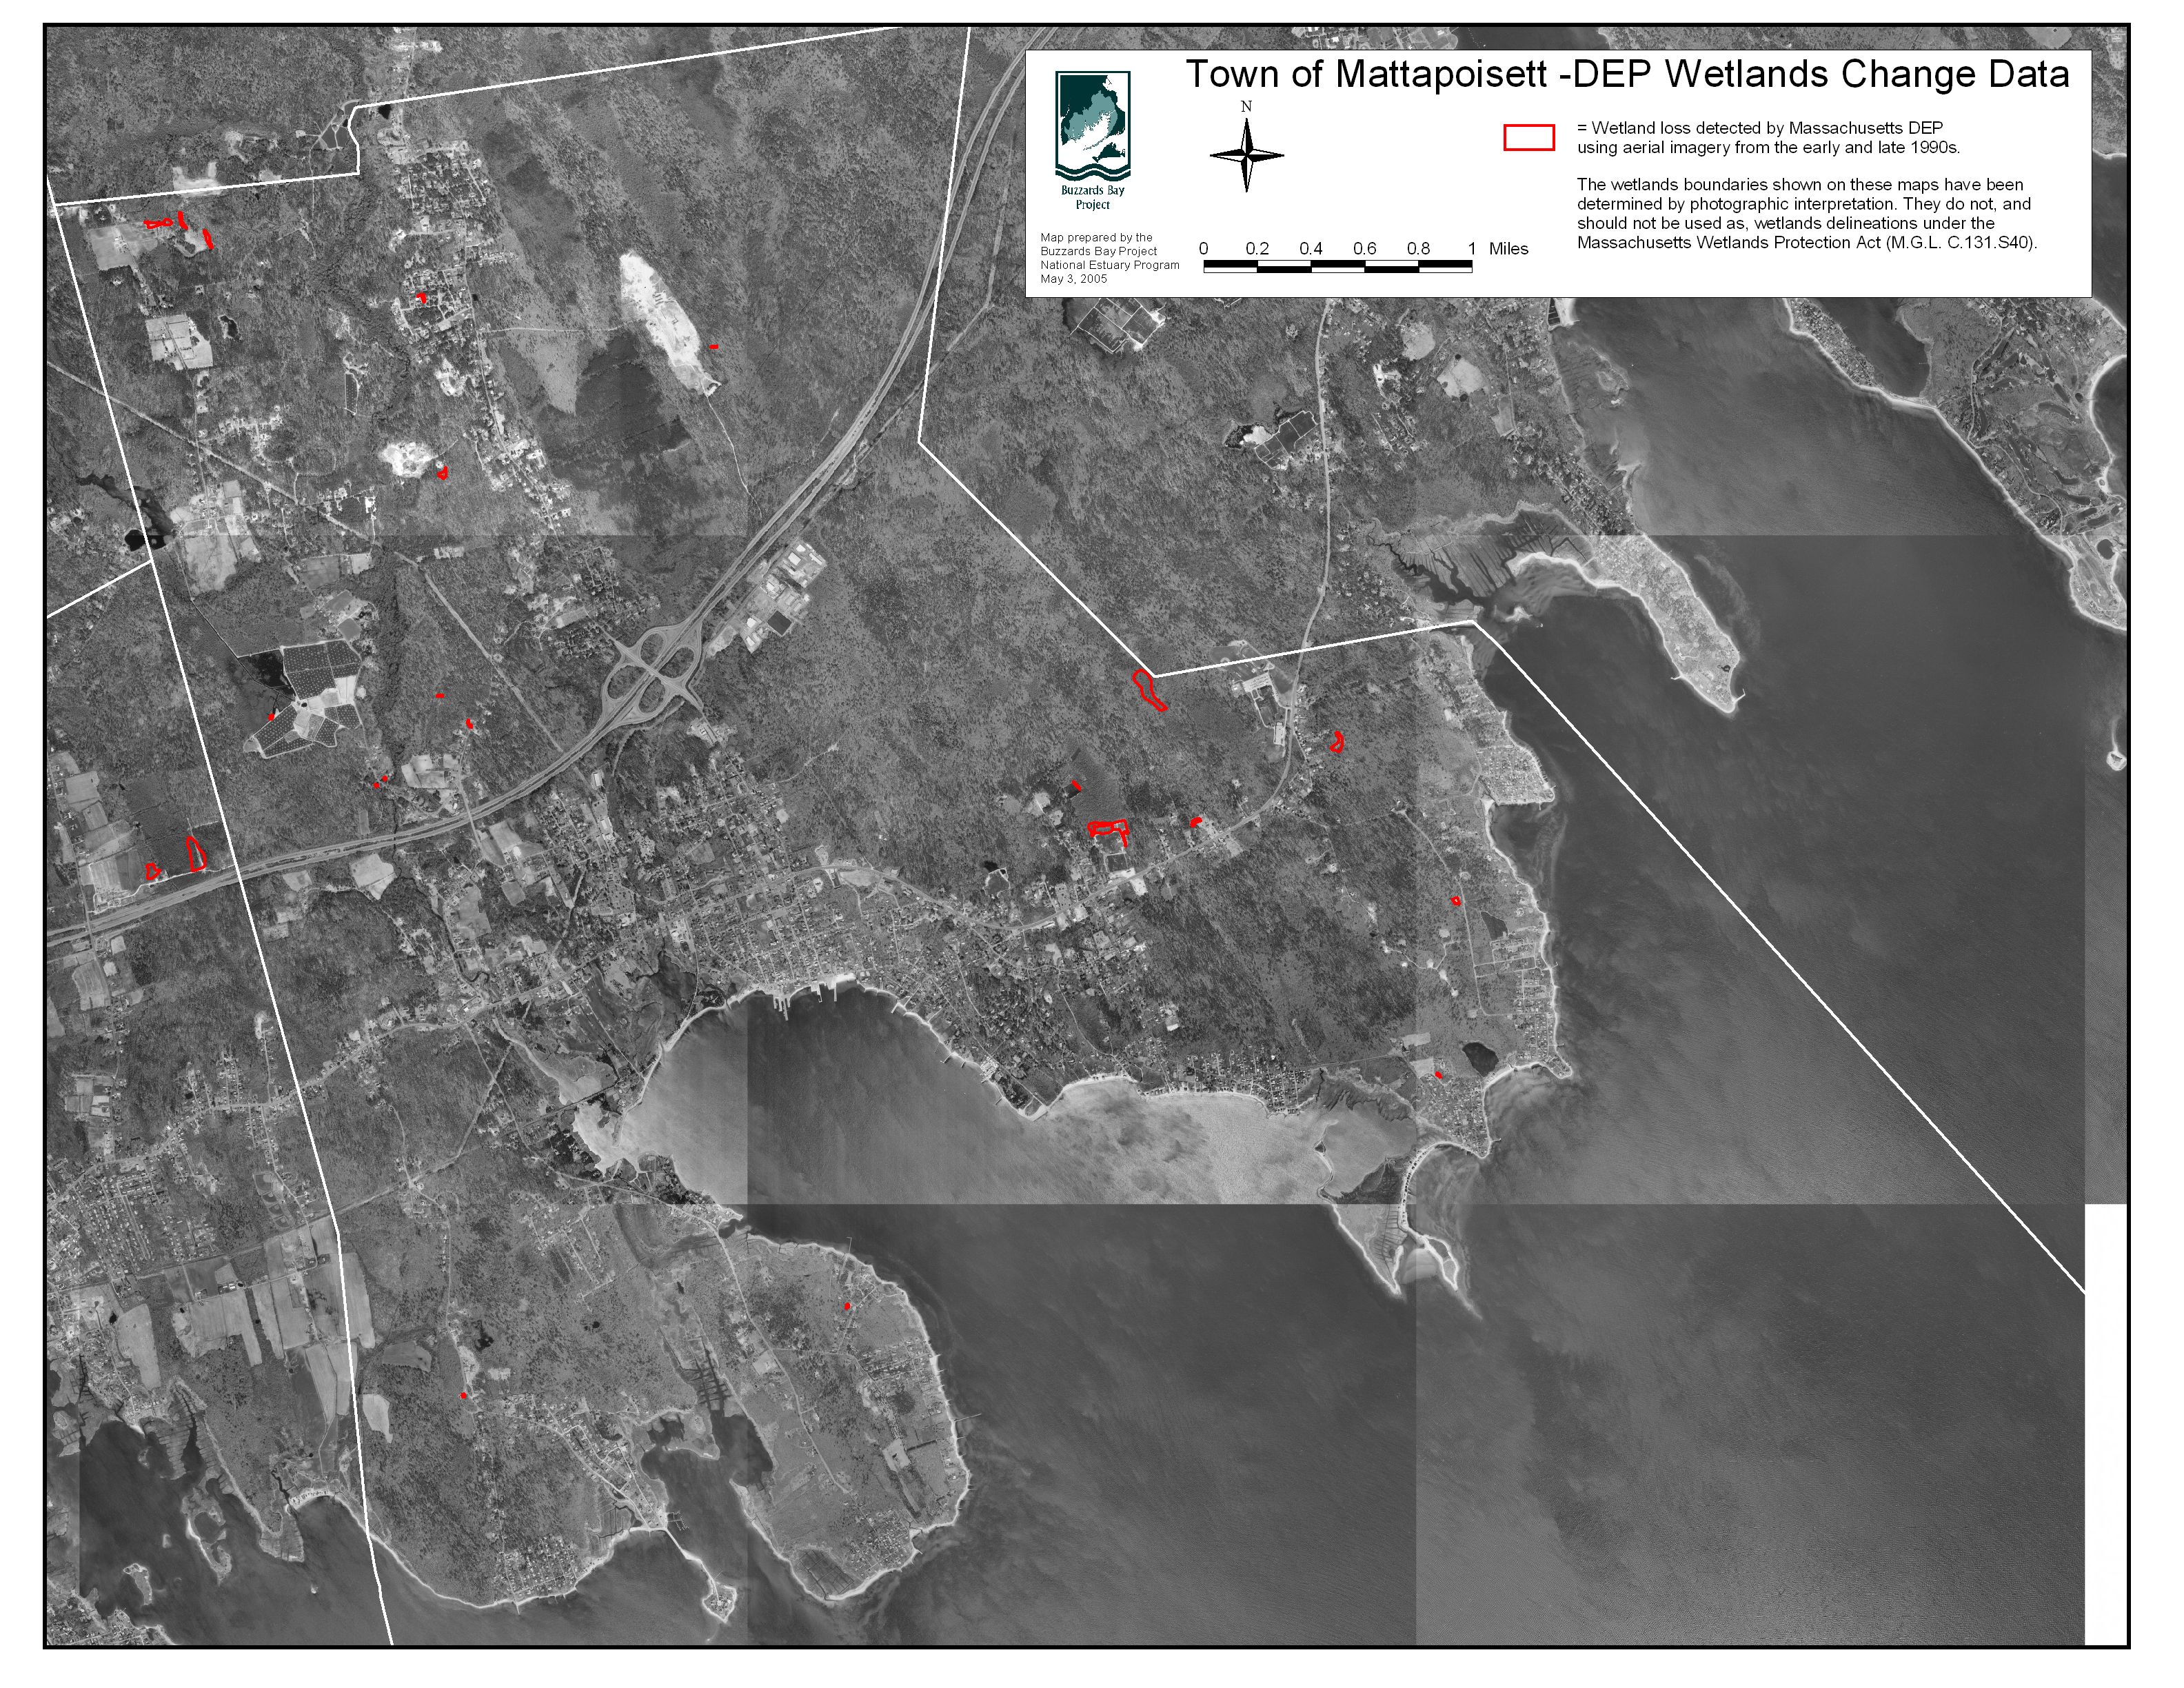
Town of Carver Wetland Loss Map
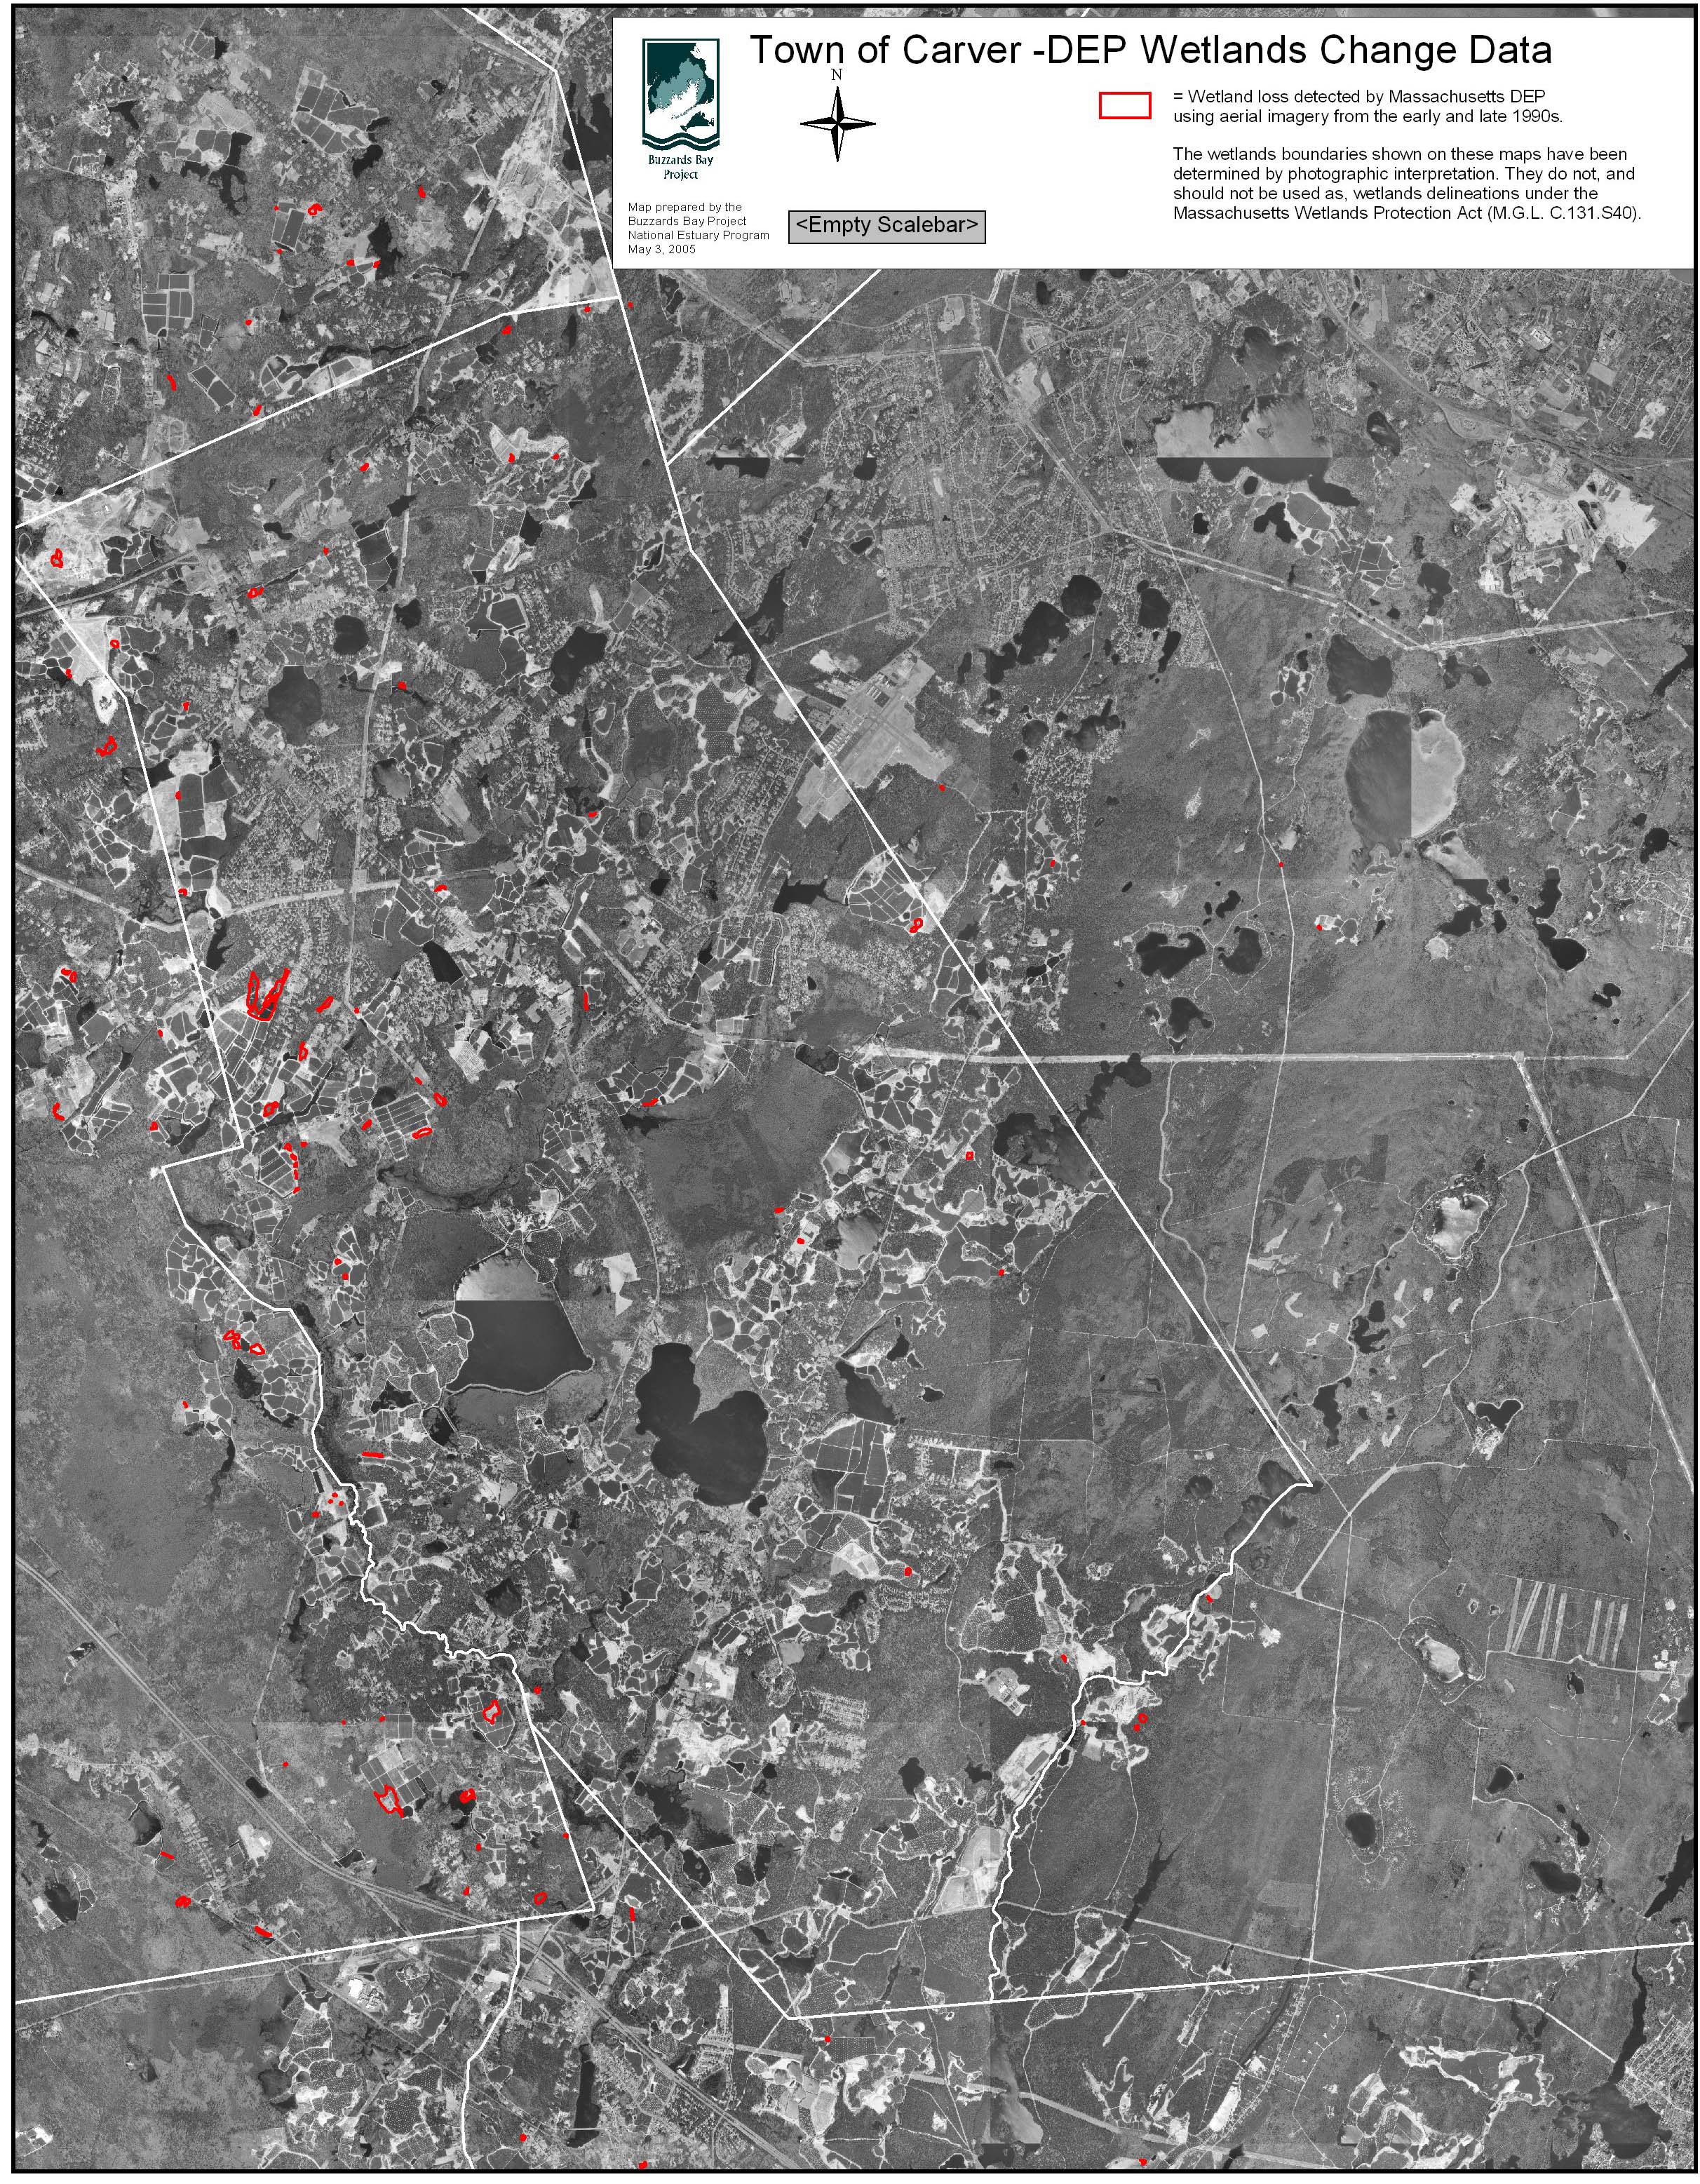
Towns of Westport and Dartmouth Wetland Loss Map
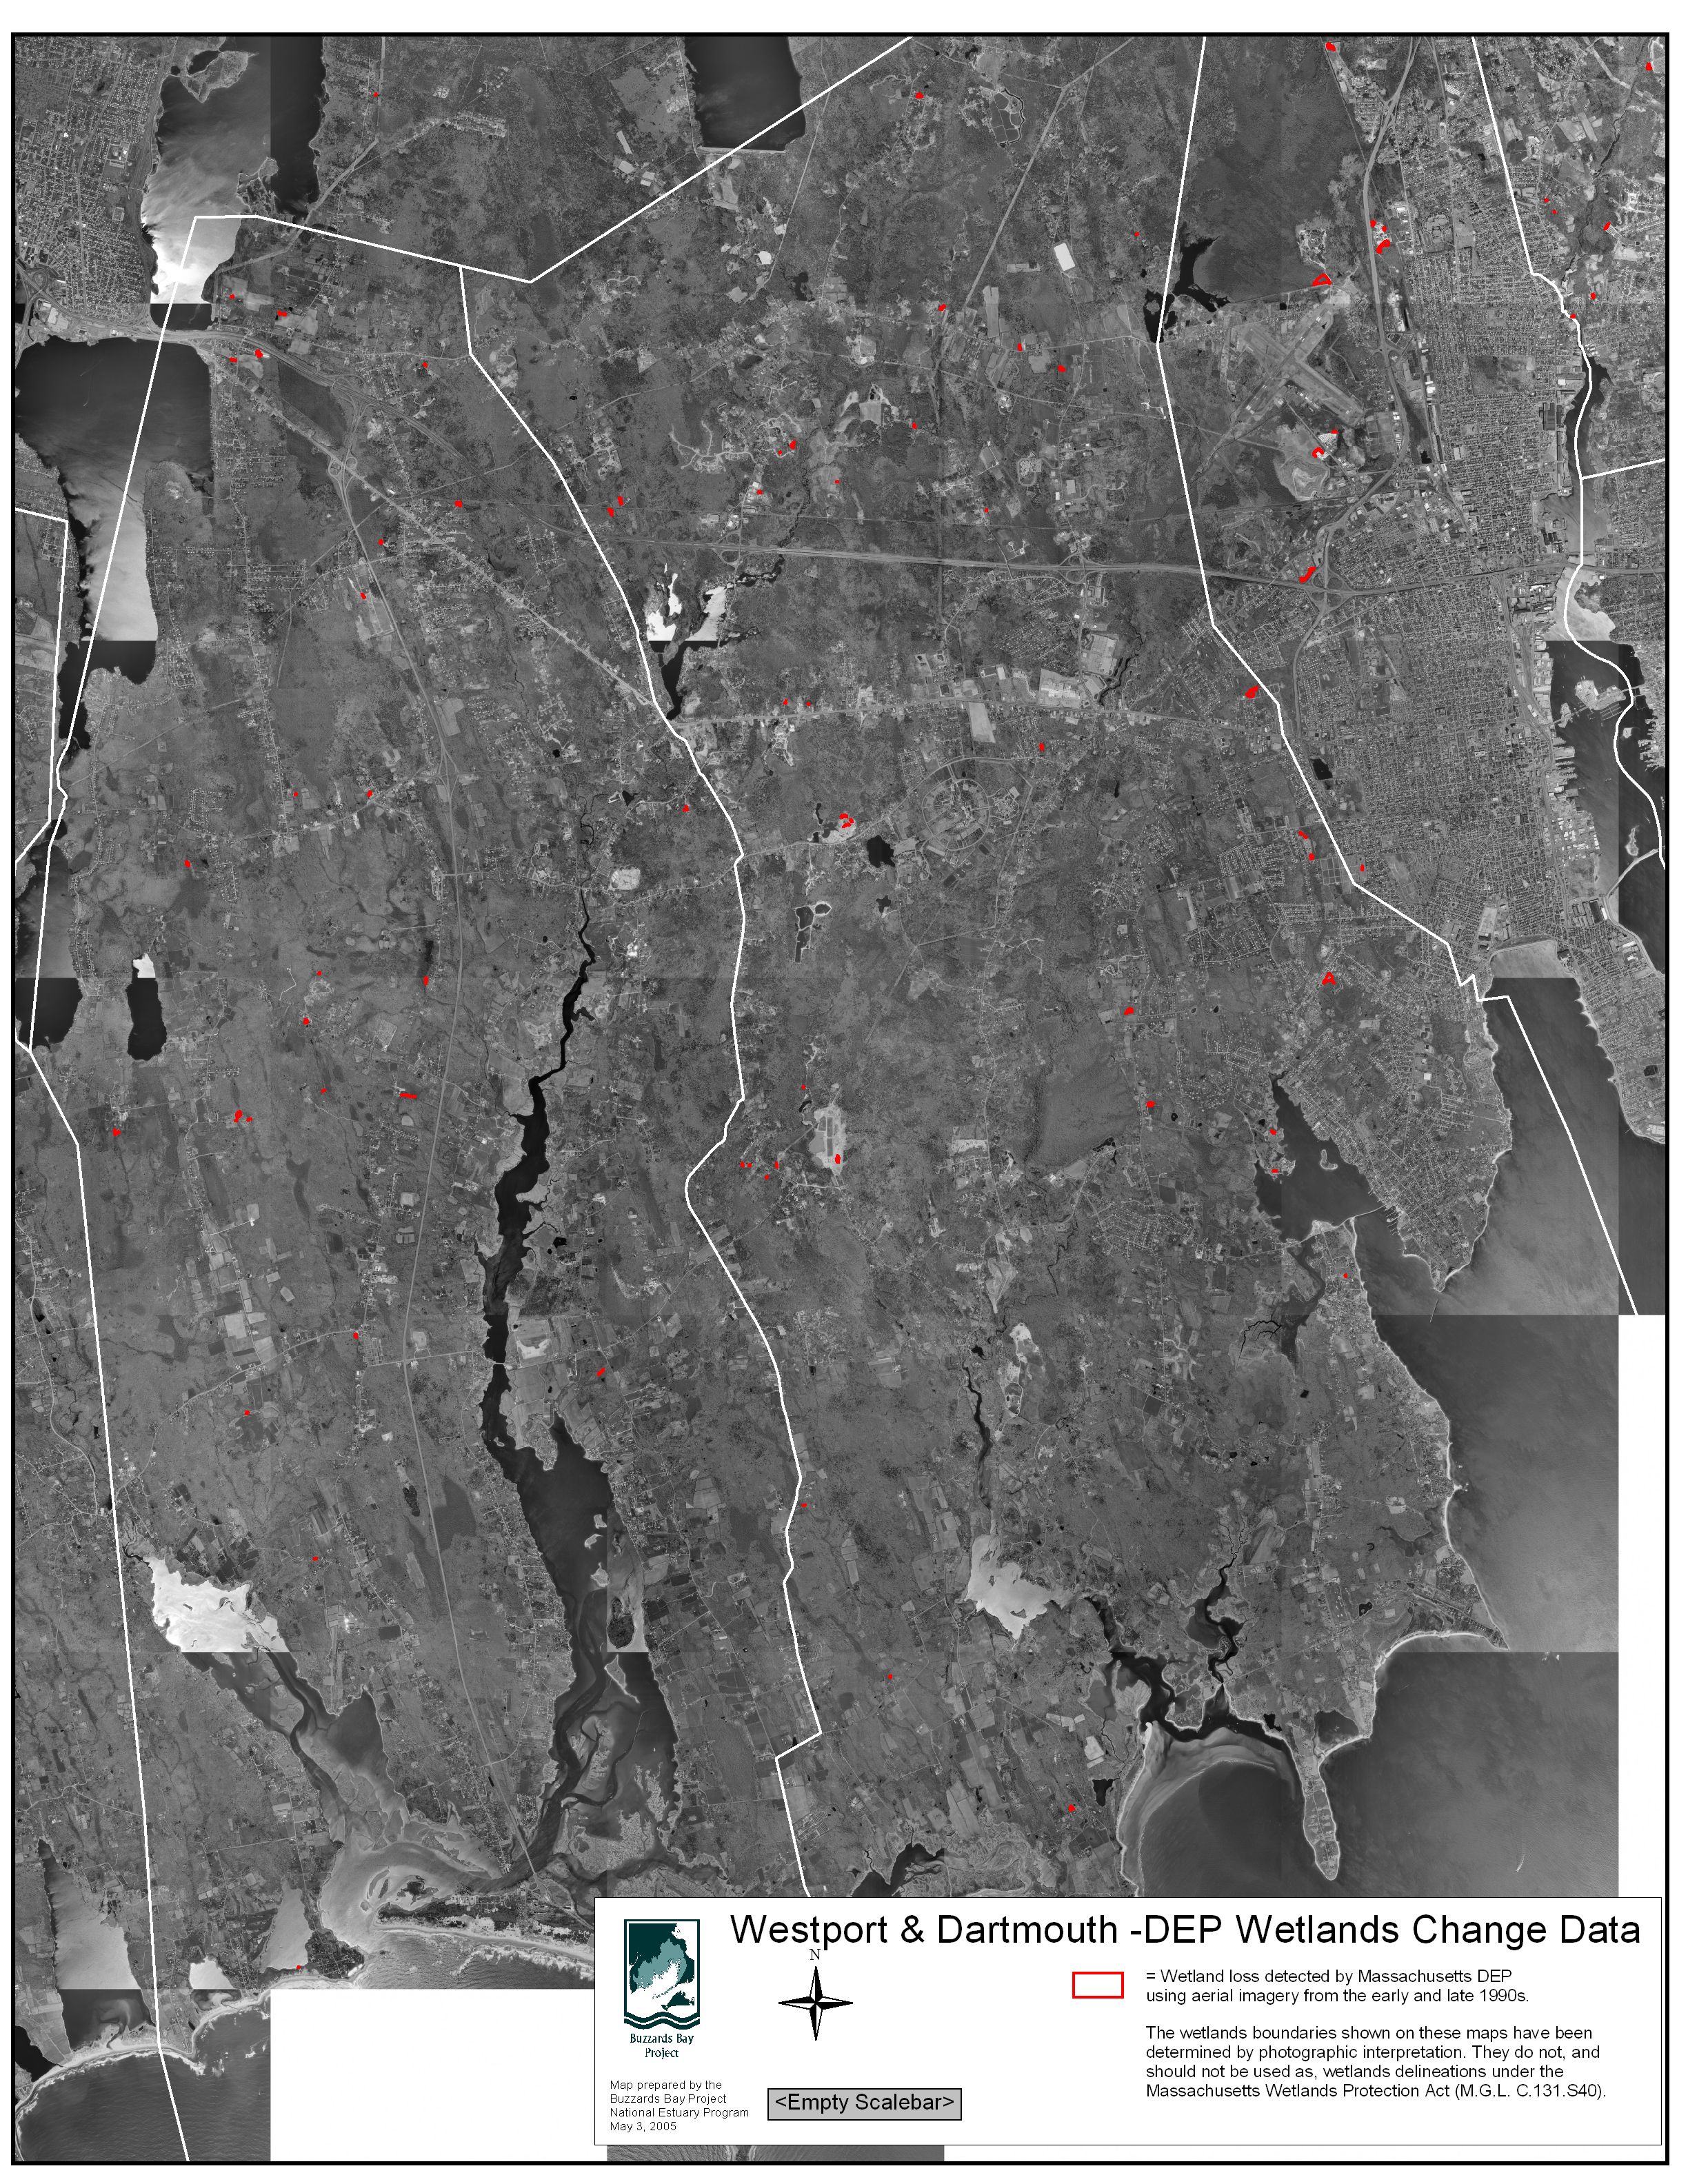
Town of Rochester Wetland Loss Map
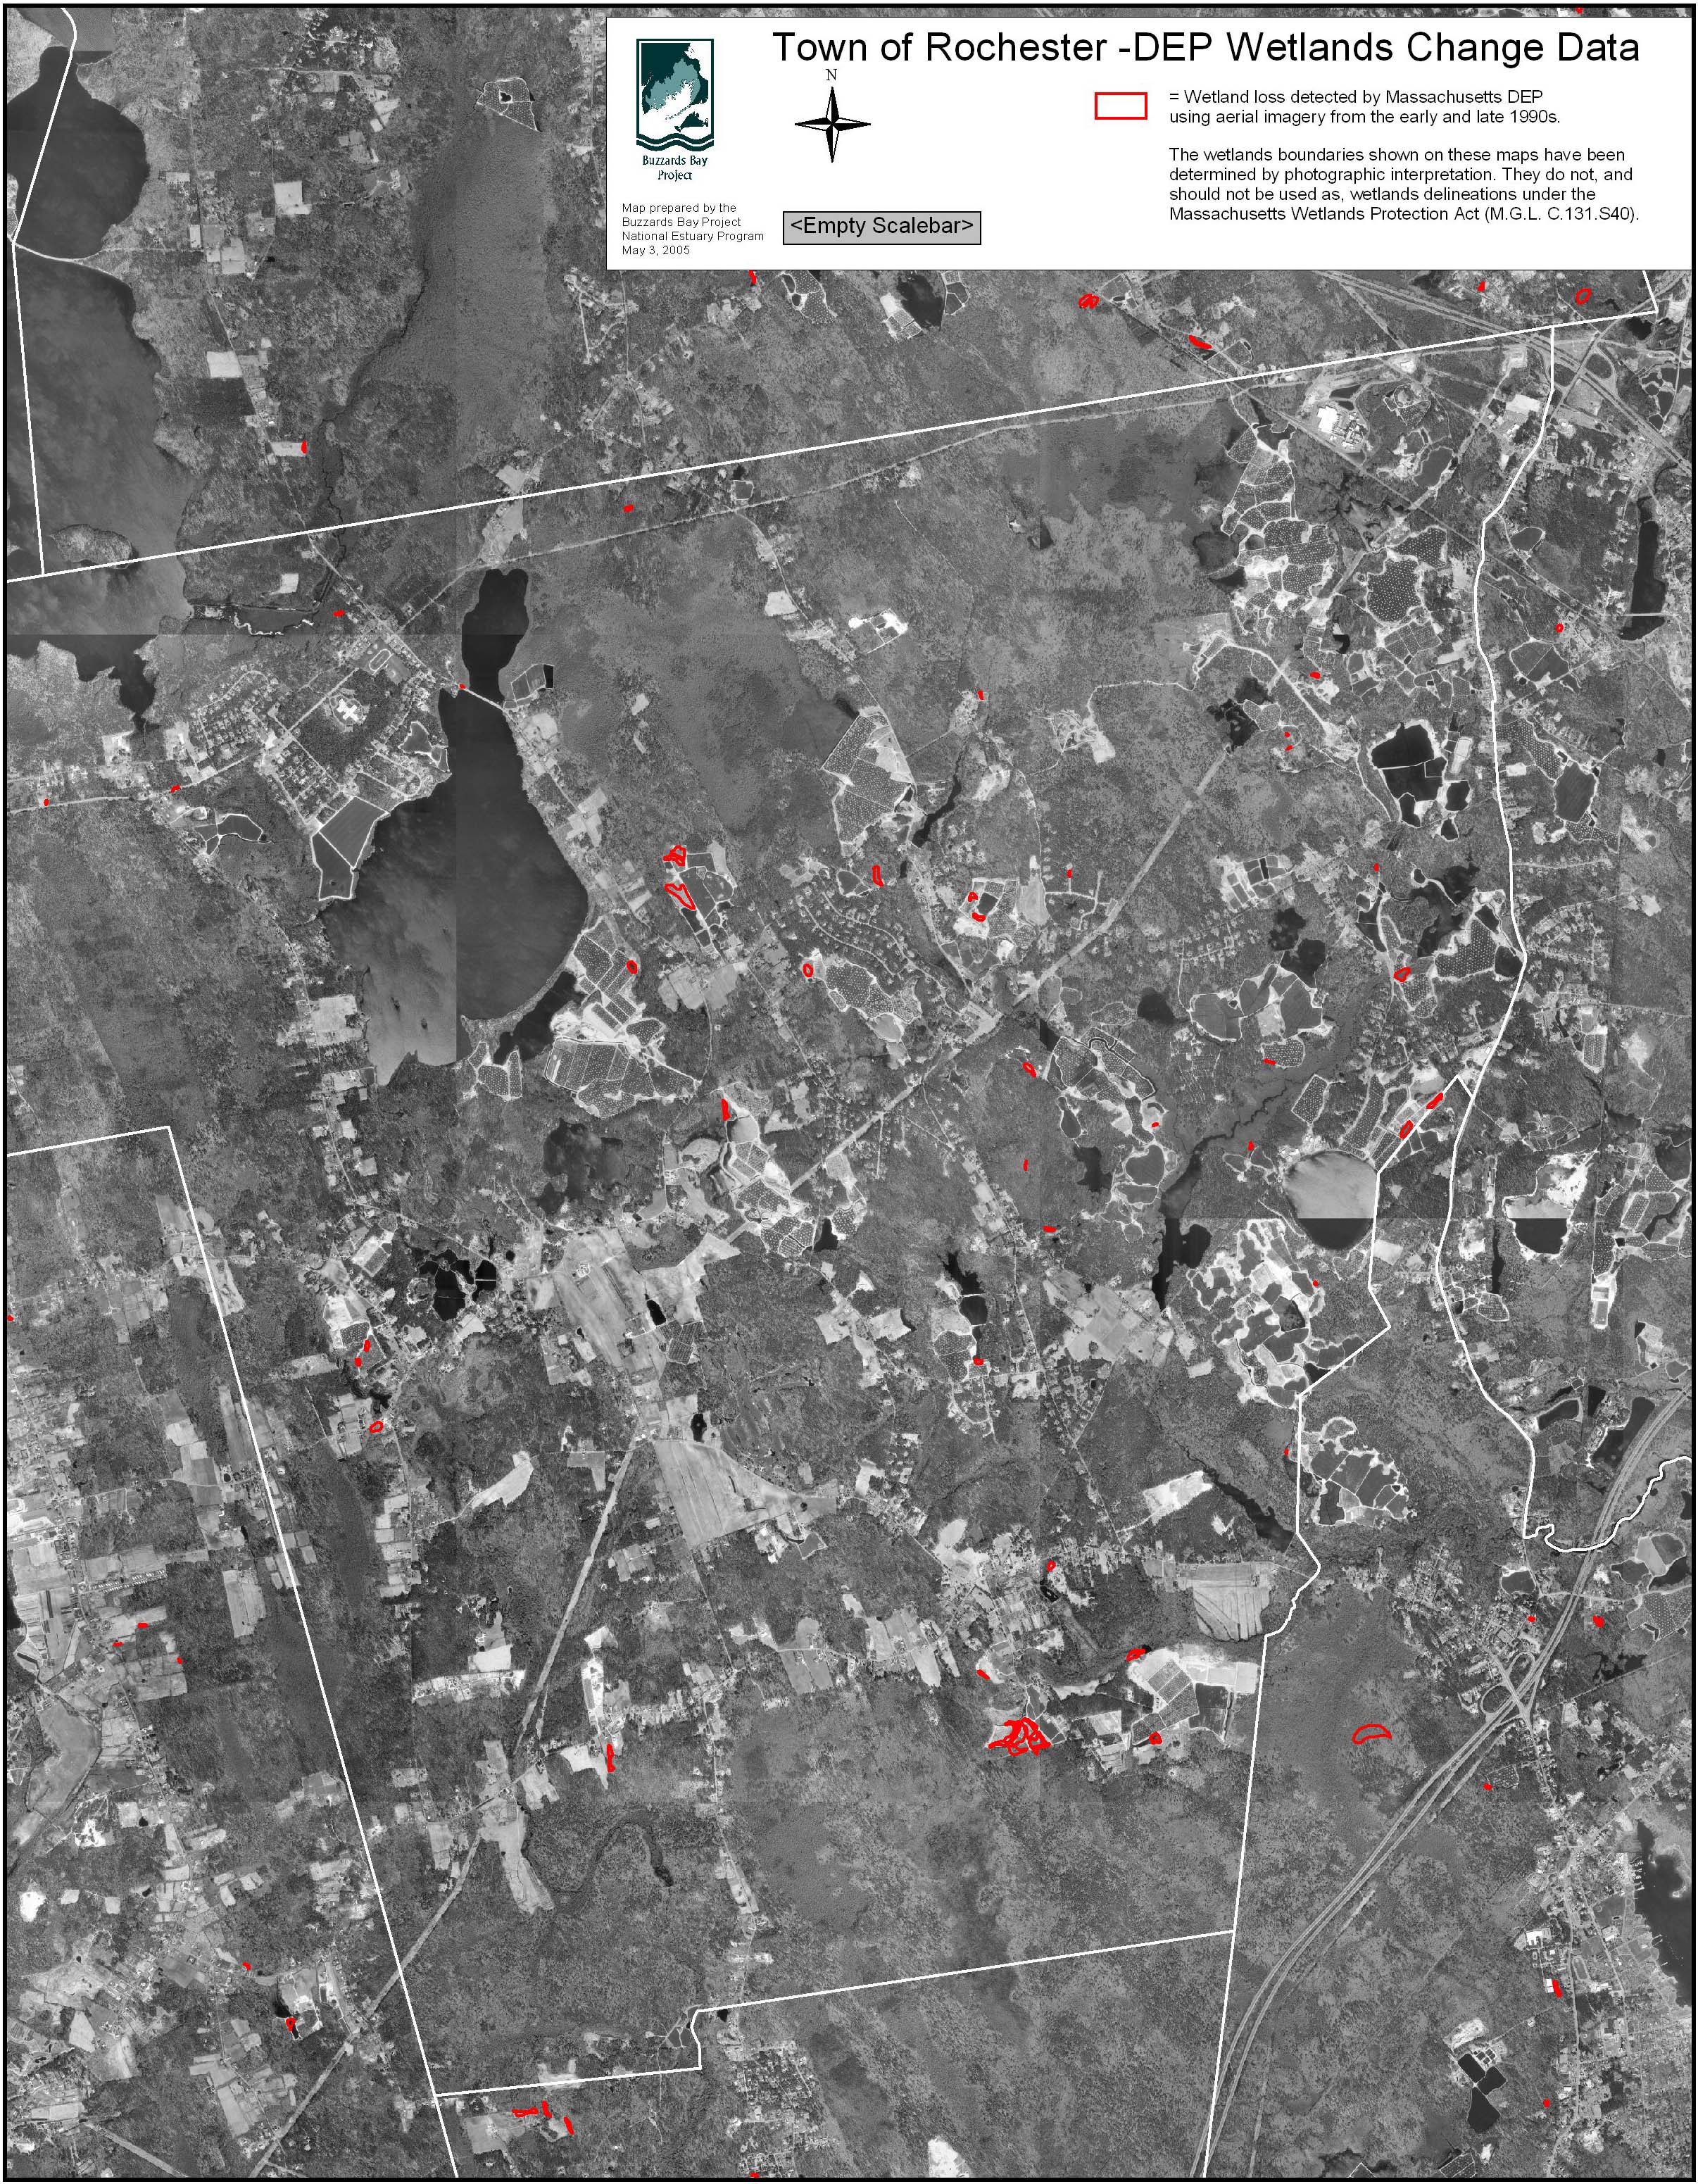
Town of Acushnet Wetland Loss Map
Town of Fairhaven Wetland Loss Map
Town of Bourne Wetland Loss Map
Towns of Falmouth Wetland Loss Map
City of New Bedford Wetland Loss Map
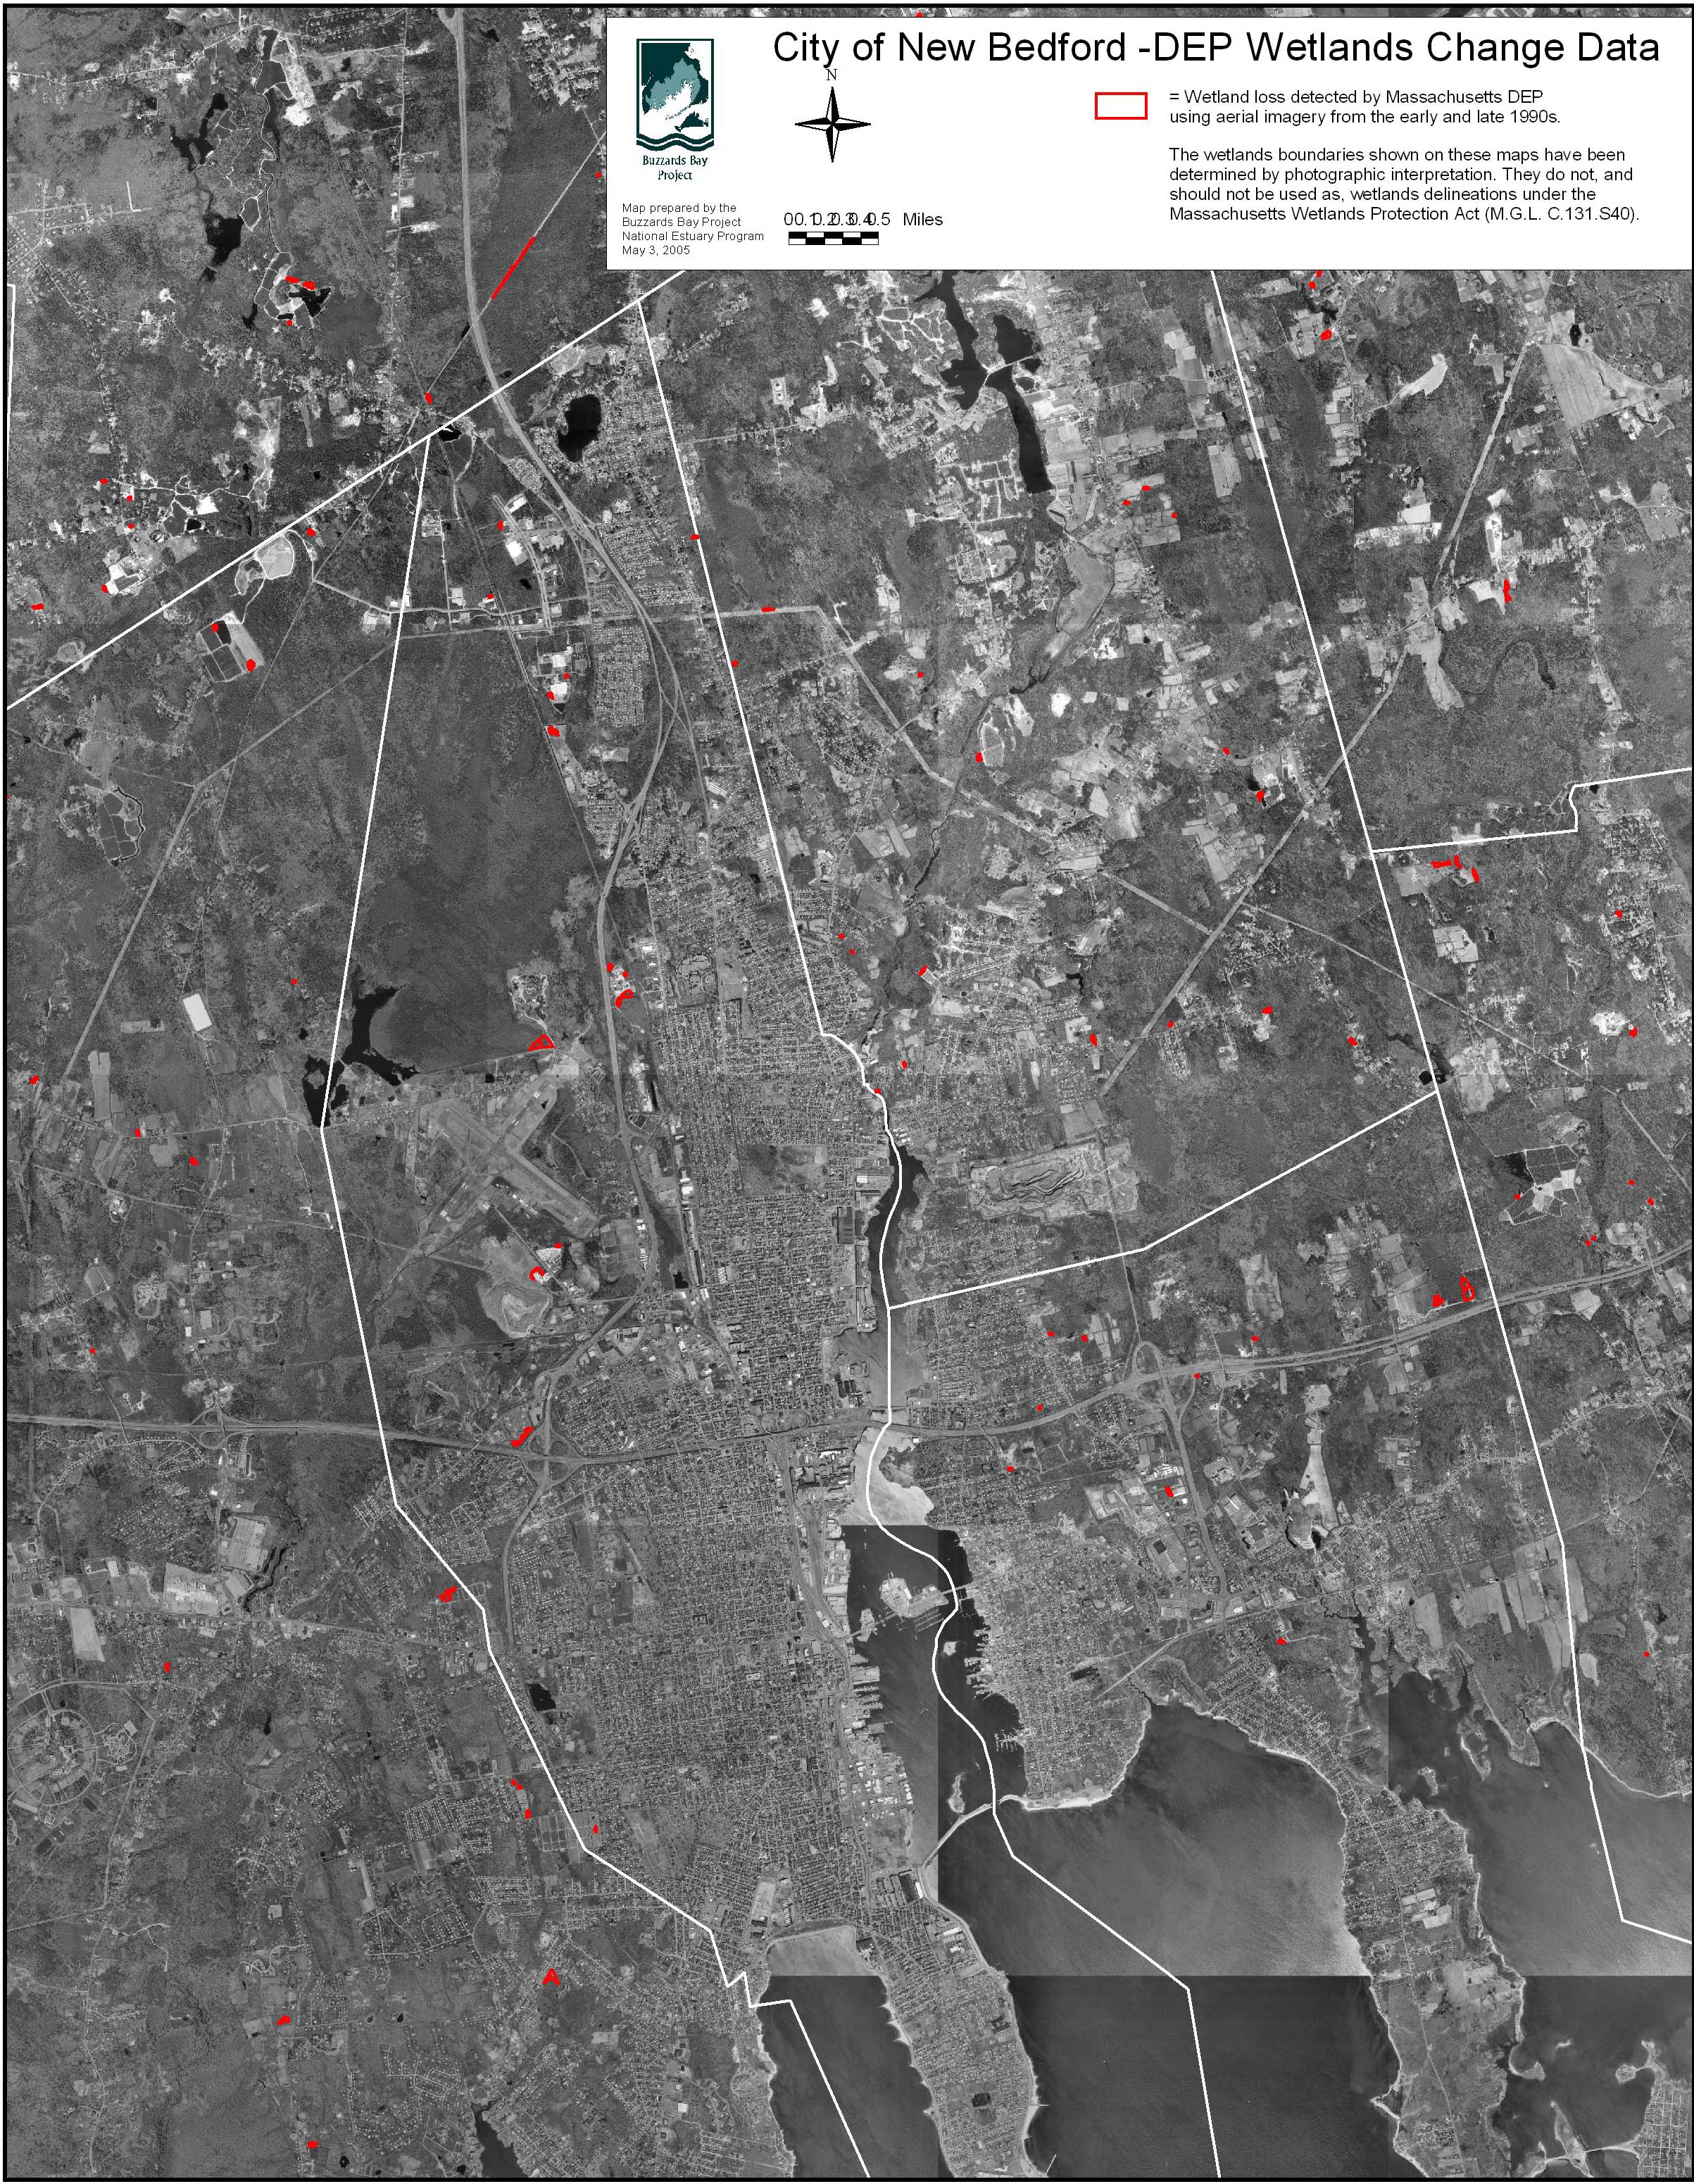
City of New Bedford and Towns of Acushnet and Fairhaven Wetland Loss Map
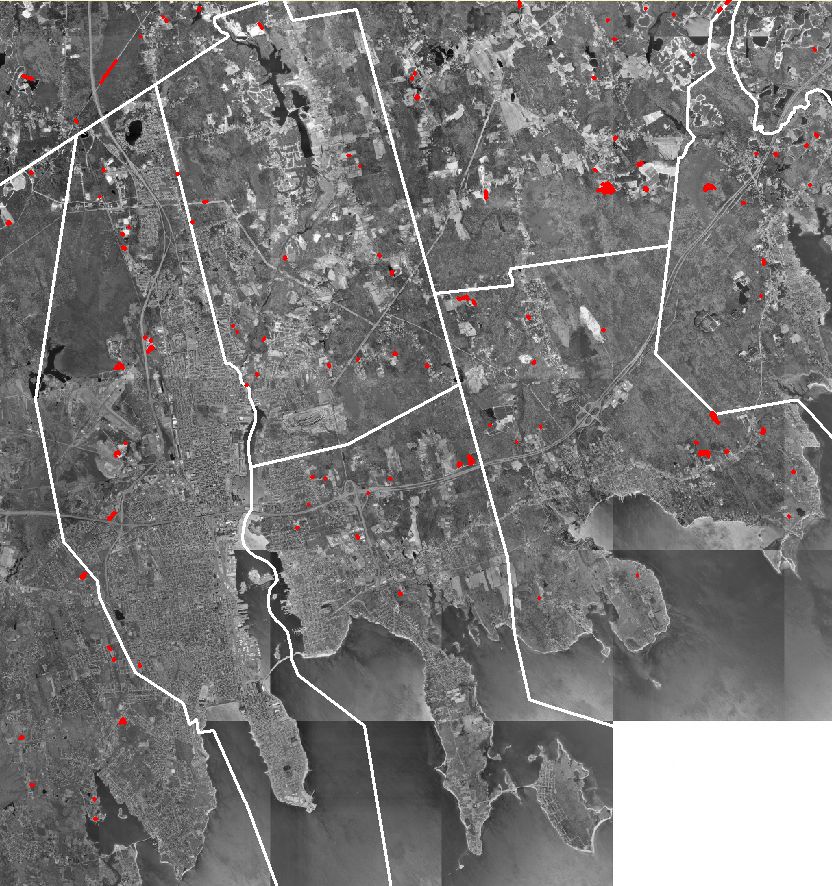
wetland-change.zip: Zip file of wetland changes Arcview TM shapefiles (polygons and centroids).
Links
Massachusetts DEP Press releases on recent enforcement cases.
Massachusetts DEP wetland loss maps information.
Massachusetts Department of Environmental Protection’s Wetland Enforcement Manual
Massachusetts DEP’s Program to Reduce Legally Permitted Wetland Loss
Massachusetts DEP’s Program to Reduce Illegal Unpermitted Wetland Loss