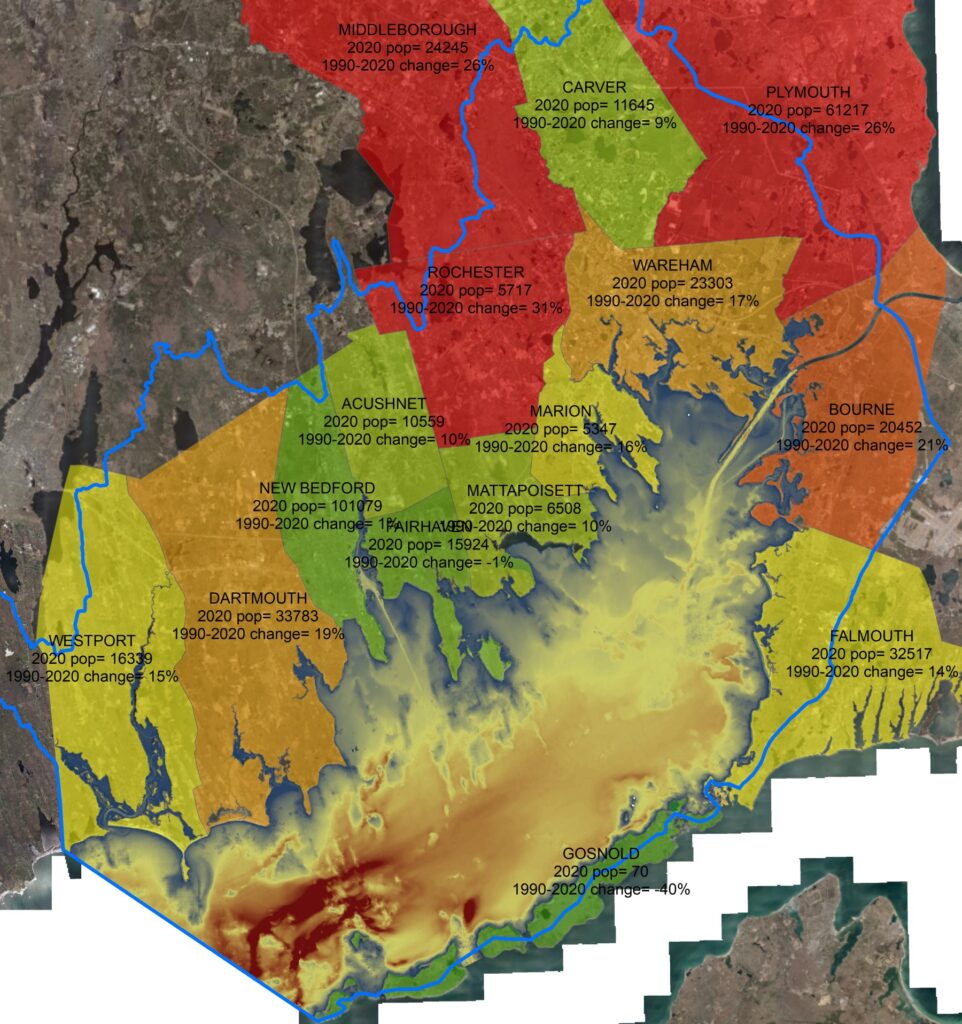
The 2020 US Census has affirmed that the Buzzards Bay watershed remains a fast-growing area. Between 1990 and 2020, the Town of Rochester led Buzzards Bay towns, with a growth rate of 31%.

U.S. Census Data, population not adjusted for watershed boundaries.
| TOWN | SQ MILES | 1930 | 1940 | 1950 | 1960 | 1970 | 1980 | 1990 | 2000 | 2010 | 2020 |
| ACUSHNET | 18.88 | 4092 | 4145 | 4401 | 5755 | 7767 | 8704 | 9554 | 10161 | 10303 | 10559 |
| BOURNE | 41.08 | 2895 | 3315 | 4720 | 14011 | 12636 | 13874 | 16064 | 18721 | 19754 | 20452 |
| CARVER | 39.72 | 1381 | 1469 | 1530 | 1949 | 2420 | 6988 | 10590 | 11163 | 11509 | 11645 |
| DARTMOUTH | 61.96 | 8778 | 9011 | 11115 | 14607 | 18800 | 23966 | 27244 | 30666 | 34032 | 33783 |
| FAIRHAVEN | 12.41 | 10951 | 10938 | 12764 | 14339 | 16332 | 15759 | 16132 | 16159 | 15873 | 15924 |
| FALMOUTH | 45.07 | 4821 | 6878 | 8662 | 13037 | 15942 | 23640 | 27960 | 32660 | 31531 | 32517 |
| GOSNOLD | 13.39 | 120 | 136 | 56 | 66 | 83 | 63 | 98 | 86 | 75 | 70 |
| MARION | 14.12 | 1638 | 2030 | 2250 | 2881 | 3466 | 3932 | 4496 | 5123 | 4907 | 5347 |
| MATTAPOISETT | 17.49 | 1501 | 1608 | 2265 | 3117 | 4500 | 5597 | 5850 | 6268 | 6045 | 6508 |
| MIDDLEBOROUGH | 72.11 | 8608 | 9032 | 10164 | 11065 | 13607 | 16404 | 17867 | 19941 | 23116 | 24245 |
| NEW BEDFORD | 20.28 | 112597 | 110341 | 109189 | 102477 | 101777 | 98478 | 99922 | 93768 | 95072 | 101079 |
| PLYMOUTH | 102.02 | 13042 | 13100 | 13608 | 14445 | 18606 | 35913 | 45608 | 51701 | 56468 | 61217 |
| ROCHESTER | 36.03 | 1141 | 1269 | 1328 | 1559 | 1770 | 3205 | 3921 | 4581 | 5232 | 5717 |
| WAREHAM | 37.14 | 5686 | 6364 | 7569 | 9461 | 11492 | 18457 | 19232 | 20335 | 21822 | 23303 |
| WESTPORT | 52.10 | 4408 | 4134 | 4989 | 6641 | 9791 | 13763 | 13852 | 14183 | 15532 | 16339 |
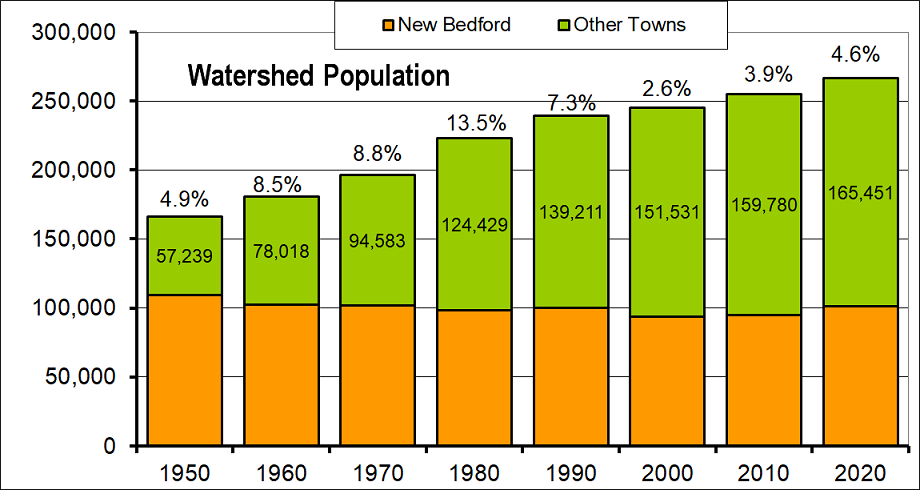
The population trends are actually complex. Because one third of the watershed population is found in New Bedford, a city with a declining population until the 2020 census. Between 2010 and 2020, the population in the entire watershed increased 4.6% , with Dartmouth and Gosnold showing the only declines.
Construction and New Development
Like most coastal areas, the Buzzards Bay watershed is losing more and more open land to development. One of the strongest indicators of population trends and changes in land use are the number of permits municipalities issue for the construction of single-family homes. The population growth outside of New Bedford has consistently been high, with the greatest increase during the 1980s when Baby Boomers drove home construction.
