Related Pages: Nitrogen Loading Assumptions | Parcel Level Analysis
[This page was posted for a 2014 assessment of loading.]
What is on this page
On this page we present summary statistics of land use and wastewater characteristics prepared by the Buzzards Bay National Estuary Program for this watershed, and from these features we have estimated nitrogen loading using Massachusetts Estuaries Project nitrogen loading coefficients. We also include, where available, other estimates of loading, as well as links to any current and historical reports on pollution in the watershed issued by the state, federal government, DEP, the Massachusetts Estuaries Project, non-profits, and independent scientists.
In our analysis, we have used attenuation coefficients contained in a draft Massachusetts Estuaries Project TMDL report. DEP has not yet approved the TMDL report for this watershed, and these attenuation coefficients may change in the final TMDL report.
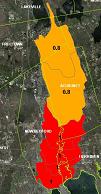
Draft subwatershed delineations and attenuations coefficients used by the MEP.
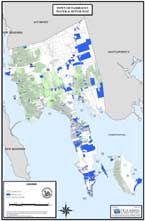
Fairhaven sewer service map prepared by a consultant in 2007. Click to enlarge.
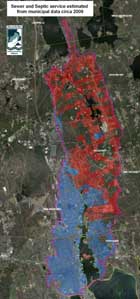
Click on wastewater service map for a larger image or open one of these files:
sewer-septic-acushnet.pdf (2.8 MB pdf)
sewer-septic-acushnet.kmz (5.5 MB Google Earth file)
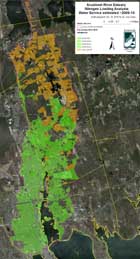
This map includes water service information from New Bedford, Acushnet, and Fairhaven. Click on water service map above for larger image or open one of these files:
water-service-acushnet.pdf (2.8 MB pdf)
water-service-acushnet.kmz (5.3 MB pdf)
We hope the information on this page will give municipal officials, planners, and residents the opportunity to review our GIS work and data and to help all to better understand any comments or analyses that we may convey to MA DEP or the US EPA. We also hope the information presented here will help convey a clear understanding of nitrogen loading characteristics for this watershed.
Evaluating watershed nitrogen loading is just one part of the process for establishing nitrogen TMDLs for impaired coastal waters. The Massachusetts DEP and EPA are setting these TMDLs based on studies being conducted by the Massachusetts Estuaries Project. More information about this effort can be found on the MEP Oceanscience.net site, UMass Dartmouth SMAST site, and this DEP TMDL page.
It is also worth noting that the US EPA has, in a fact sheet, released estimates of nitrogen loading contained in a 2009 draft report prepared by the Massachusetts Estuaries Project, not yet publicly available. Those EPA reported estimates of nitrogen loading are contained in the links on this page under the section titled “Wastewater Facility and Other Permitted Discharges.”
Watershed delineations
The watershed used for the analysis presented on this page is the subwatershed adopted by the Massachusetts Estuaries Project, and is based on land surface topography defining a bedrock valley watershed. Except for a few small areas, it is nearly identical to the watershed adopted by the Buzzards Bay NEP in 1990, and was based on subwatershed delineations developed and refined by Mass DEP and USGS in the 1980s and 1990s, and affirmed in more recent reviews as described on our Buzzards Bay watershed boundary changes page.
Watershed GIS shapefile (zipped): acush_riv_1shed_16jul10.zip
Watershed Google Earth file: acush_riv_1shed_16jul10.kmz
Subwatersheds and Attenuation
As of September 2010, the Massachusetts Estuaries Project used the subwatersheds with the net nitrogen transmission coefficients specified in the table below and map to the right. Although the TMDL report is in draft form and not released to the public, the US EPA is using the draft report to set a nitrogen limit for the Fairhaven wastewater treatment facility, so we are posting these watershed attenuations from the draft MEP report. These attenuation coefficients apply to watershed loads, not direct discharges like CSOs.
| SubShed ID | SubShed Name (S to N) | SubShed Acres | Net N Transmission |
| 1 | New Bedford Reservoir | 4,752 | 0.80 |
| 2 | Upper Acushnet River | 6,495 | 0.80 |
| 3 | Middle Acushnet River | 3,389 | 1.00 |
| 4 | Lower Acushnet River | 2,079 | 1.00 |
| 5 | Inner New Bedford Harbor | 846 | 1.00 |
| 6 | Outer New Bedford Harbor | 1,934 | 1.00 |
Subwatershed GIS shapefile (zipped): acush_riv_sheds_16jul10.zip
Subwatershed Google Earth file:acush_riv_sheds_16jul10.kmz
Sewering and Septic Use
Sewered properties in New Bedford and Acushnet are principally served by the New Bedford wastewater facility. Sewered properties in Fairhaven are served by the Fairhaven wastewater facility, and there has been relatively modest expansion of sewering in the watershed between 2005 and 2010. Most new sewering connections were the result of new buildings in already sewered areas between 2005 and 2010.
The extent of sewering in this watershed was determined by matching sewer bill accounts to parcels. This process is more accurate than relying on Assessors data because the database fields associated with the utilities in assessor databases are not a required field, and the information is often incomplete or out of date. This process is not 100% perfect, so we also send these maps to municipalities for review. The maps for this watershed are still in draft form.
Compare our maps of wastewater and water service in the Fairhaven portion of the watershed to the map on the right prepared by a consultant in 2007. Note first that there is generally good agreement between our map and those prepared by the consultant, but note also how many properties were not defined on the 2007 map with respect to water or sewer service because of the incompleteness and imperfect matching of the databases used.
| Year | parcels with wastewater | parcels with sewer | parcels with septic systems | buildings with wastewater* | number of septic systems** | units served by septic systems |
| 2010 | 23,271 | 19,995 | 3,276 | 23,567 | 3,343 | 3,476 |
*This estimate includes structures with presumed wastewater service (sewer or septic) and does not include residential garages or other accessory commercial or residential structures. A two-family dwelling may consist of two units (condos or apartments) in one structure. **The number parcels with septic systems may be slightly less than the estimated number of septic systems, or buildings served by septic systems (not shown) because there can be multiple residential or commercial buildings on one parcel and in some cases they may be presumed to share a septic system or have separate septic systems depending on their proximity (townhouses would likely have one septic system; larger parcels with two residential dwellings will presume to have two septic systems. For any given watershed, the number of units, buildings, and septic systems are not equal. There are more “units” in a watershed than “buildings” because a building may have multiple residential or business units. For example, a two-family dwelling may consist of two units (condos or apartments) in one structure, but that one structure may be served by a single septic system. For septic system loading calculations, units is probably the best value to use of the three parameters.
Septic Use by Town
In the table below is a summary of the number septic systems, estimated by the BBNEP, in each municipality in the watershed circa 2009. This breakdown does not represent the relative contribution of septic loading from each town, because only 80% of the septic nitrogen in the upper watershed reaches the estuary (see loading table below).
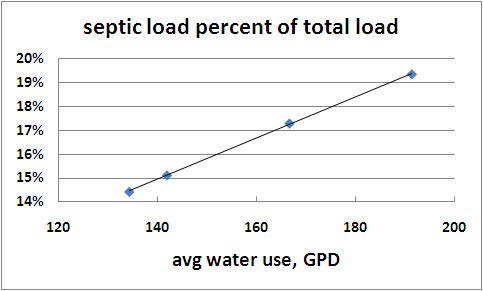
To calculated septic system nitrogen loading, the MEP multiplies average annual water use (less 10% for assumed non-wastewater use like lawn watering), times an assumed groundwater discharge concentration of 26.25 ppm (see discussion on our nitrogen loading assumptions page. For our analysis on this page, we have used an average water use of 166.7 GPD (with 90% discharged via septics), which is slightly higher than some other watersheds, but intermediate in water use between all water users and septic users only in the watershed as explained in the septic loading section below.
| Municipality | 2005 estimated septic systems | 2005 estimated septic units | 2010 estimated septic systems | 2010 estimated septic units |
| ACUSHNET | 2544 | 2633 | 2563 | 2670 |
| DARTMOUTH | 0 | 0 | 0 | 0 |
| FAIRHAVEN | 34 | 37 | 34 | 37 |
| FREETOWN | 499 | 513 | 505 | 520 |
| LAKEVILLE | 28 | 28 | 28 | 28 |
| NEW BEDFORD | 121 | 126 | 121 | 126 |
| ROCHESTER | 92 | 95 | 92 | 95 |
| Total | 3318 | 3432 | 3343 | 3476 |
Note that the estimated number septic systems is slightly higher than the number of parcels with septic systems because a few parcels with multiple buildings are presumed to have two or more septic systems, and because a few parcels have not been updated with new subdivisions of land. Similarly, the number of units served by septics is yet higher because there are some properties that have more than one unit on the property with a single septic system (e.g. a two family bungalow).
Septic Use by Subwatershed
In the table below is a summary of the number septic system numbers estimated by the MEP subwatersheds described above.
| Subwatershed (S to N) | 2005 estimated septics | 2010 estimated septics |
| New Bedford Reservoir | 972 | 986 |
| Upper Acushnet River | 1842 | 1853 |
| Middle Acushnet River | 466 | 466 |
| Lower Acushnet River | 15 | 15 |
| Inner New Bedford Harbor | 13 | 13 |
| Outer New Bedford Harbor | 10 | 10 |
| Total | 3318 | 3343 |
Residential and Commercial Water Use
As of 2010, an estimated 1,321 developed parcels with wastewater service in the watershed were presumed to have well water, and an estimated 18,900 developed parcels with wastewater being served by municipal water, having a water account matched to the property. For parcels served by municipal water, water use is broken down by septic and sewer service in the table below.
Average Water Use, Entire watershed
Water use records were only obtained for Fairhaven (2010), New Bedford (2010) and Acushnet (2006), but these three communities together account for 82% of the septic systems in this watershed as shown by the table above. Note that water use of single family homes on septic systems are considerably higher than properties on sewer. This difference may not be related to increased occupancy and higher wastewater output of properties on septic systems, but rather may be the result of increased water consumption associated with increased lawn size and swimming pool use. The average water user for single family homes for both septic and sewer users combined, is 142 gpd. For the loading calculations in the pie chart below, we used 166.7 gpd as the average residential water use (90% of which is discharged to septics as per MEP assumptions). See additional discussion below.
| use (code) | avg gpd, on septic | No. on septic | avg gpd, on sewer | No. on sewer |
| Single Family (101) | 186.4 | 1711 | 134.4 | 10046 |
| Mobile home or park (103) | 129.2 | 38 | 246.2 | 21 |
| Two Family (104) | 204.7 | 43 | 221.4 | 3577 |
| Multiple use, Prim. Resid. (13) | 207.2 | 19 | 271.2 | 34 |
| Multiple Houses (109) | 161.4 | 8 | 226.1 | 60 |
| Small Retail (325) | 249.7 | 7 | 317.6 | 271 |
Water Use, Acushnet Water Accounts Only
This table is for 2006 water use and includes a small fraction of with zero-water use accounts (presumably vacant properties). Without these properties included, single family homes averages 191.4 GPD. Most of the homes with septic, where water use has been obtained, are in the Town of Acushnet. Properties on septic have, on average, larger lot sizes. Based on a visual inspection, the top water users in Acushnet (115 properties exceed 410 gpd) nearly exclusively are large homes with large lawns and or have swimming pools, and the higher water uses on these properties probably largely reflects use of water by lawn irrigation systems and pools. Lot size is a poor predictor of water use, but for single family homes, there is a slight correlation between water use both with total number of rooms in a home, and total building value. Because there is uncertainty as to the most meaningful water use value to use for septic watershed loading, several different values are used in the septic loading sensitivity analysis below. The Massachusetts Estuaries Project assumes 90% of the residential water use is discharged via septic systems.
| use (code) | avg gpd, on septic | No. on septic | avg gpd, on sewer | No. on sewer |
| Single Family (101) | 187.5 | 1619 | 143.4 | 681 |
| Mobile home or park (103) | 122.7 | 40 | 113.0 | 19 |
| Two Family (104) | 190.5 | 37 | 203.5 | 90 |
| Multiple use, Prim. Resid. (13) | 196.8 | 20 | 225.6 | 16 |
| Multiple Houses (109) | 161.4 | 8 | 226.1 | 6 |
Wastewater Facility and Other Permitted Discharges
The Town of Fairhaven wastewater facility discharges into New Bedford Harbor (NPDES permit MA0100765, go to our wastewater facility page for more links). The facility has a discharge limit of 5.0 MGD and serves Fairhaven and portions of Mattapoisett. It has secondary effluent treatment and currently has no discharge limits for nitrogen, but the town is required to monitor nitrogen concentrations (shown below), flow, and report loading as pounds per day. The current permit expired April 4, 2005 and a new Fairhaven NPDES permit has been drafted by the US EPA based on the MEP’s 2009 draft TMDL report that has not yet been publicly released. The new proposed nitrogen limit for the Fairhaven Facility is 125 lbs per day (read also the EPA fact sheet).
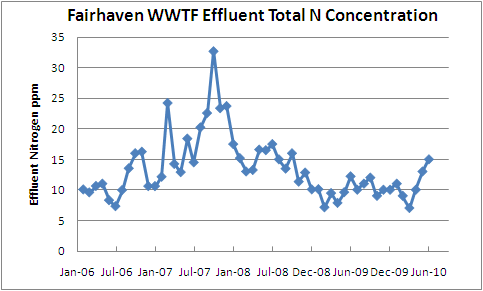
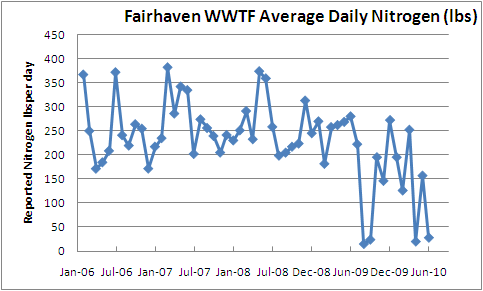
The chart below shows the Fairhaven WWTF effluent average daily nitrogen loading values (for each month), as reported to EPA between 2006 and 2010. During the 2006 and 2007 period, mean average daily loading was 255.2 lbs per day. Based on this value annual loading could be construed as 93,148 lbs (42,263 kg). There are different ways to evaluate the facility’s loading because there is a weak correlation between average flow and average concentration, but for the purpose of this loading analysis, the 93,148 lbs value was used because the town’s methodology can be reasonably extrapolated to annual loading, and this period coincides with the MEP loading analysis. The wastewater facility loading is somewhat higher than the MEP estimate for in their 2009 draft report, which was the average loading for the 2004-2006 period, and which had an average annual total of 86,476 lbs (39,236 kg). The graph below suggests the Town of Fairhaven has improved the nitrogen removal capacity of the plant somewhat after 2007. For the period June 2009 to June 2010, the facility averaged only 148.6 lbs/per day, which is an annual total of 54,239 lbs per year (24,609 kg). The 2006-2007 wastewater facility nitrogen discharge estimates and graphs are based on the calculations in this BBNEP spreadsheet.
The City of New Bedford has had 13 active CSO discharges in the harbor, but during the last decade the City has made a considerable effort to eliminate discharges or clean or modify the CSO structures so they are more likely to discharge only under higher flows. In the 2009 draft MEP report, the MEP estimated that circa 2006, the New Bedford CSOs annually discharged 21,392 lbs of nitrogen (9,706 kg), but by 2030, the MEP assumed they would discharge only 14,295 lbs (6,486 kg).
Stormwater Exclusive of CSOs
Two problems exist when attempting to characterize stormwater related nitrogen loading for the Acushnet River estuary. First, like some other heavily urbanized watersheds around Buzzards Bay, simplified assumptions of impervious area per building will not effectively characterize stormwater. In less urbanized areas, an assumed average roof and driveway impervious area is often used (see our nitrogen loading assumptions page), but these assumptions underestimate actual impervious areas in heavily urbanized and industrial watersheds. In these instances, it is best to use a modification of the MassGIS Impervious data as we describe on our Using MassGIS Impervious data for Stormwater Planning web page. We used this impervious cover for our estimates on this webpage.
Second, and more problematic, is the fact that a large portion of stormwater in the City of New Bedford is captured and conveyed by a Combined Sewer Overflow system. For small volume rainfalls, all rainwater is captured by this CSO system and conveyed to the New Bedford wastewater system that discharges into Buzzards Bay. Only for larger rainfalls do the CSOs discharge into the harbor. In their draft study, the Massachusetts Estuaries Project used a 2006 analysis by the firm Camp Dresser and McKee that estimated annual CSO overflow volumes.
However, there is also a volume of stormwater that is captured and conveyed by stormwater-only networks that discharge directly to the estuary. Like other stormwater networks, these pipes probably discharge for any rainfall greater than 1/8 inch.
We are unaware of any estimates of stormwater flow from these stormwater-only discharges. For the purpose of the analysis presented here, we have arbitrarily assumed 90% of the rainfall on impervious areas in the four lowermost segments of the estuary that are within the City of New Bedford are captured by the CSO system and are accounted for by the CSO loading estimates of the MEP (or are conveyed to the wastewater facility at lesser volumes). Stormwater in the other towns and in the upper watershed are presumed to contribute loading in the same way as in other watersheds evaluated by the MEP where there are no CSOs. The table below summarizes the contribution of these stormwater sources. In this table we used actually used a 85% capture rate assumption which eliminates about 75% of the nitrogen that would normally be presumed to originate from stormwater in the lower estuary. We are uncertain as to whether a 85% or 90% capture assumption is realistic for the CSO network in New Bedford. Stormwater discharges from Acushnet, Fairhaven, and other areas are unaffected by these assumptions. Actual CSO discharges from the MEP’s loading analysis are presented in the summary table and pie chart at the bottom of this page. For this analysis we used the rainfall rates used the MEP’s draft 2009 TMDL report (90% of an annual precipitation of 47.8″; see also our nitrogen loading assumptions page).
| Shed ID | Road Acres | Parcel Acres | non-road imprv roof ACRES | non-road imprv parking ACRES | Unatten lbs N imperv total | CSO_LOSS, New Bedford Only | Unatten lbs N imperv adjusted | N TRANS | ATTEN LBS N IMPERV TOTAL |
| 1 | 27.7 | 60.2 | 30.1 | 30.1 | 983 | 983 | 0.80 | 787 | |
| 1 | 38.5 | 76.7 | 38.3 | 38.3 | 1,297 | 1,297 | 0.80 | 1,037 | |
| 1 | 3.1 | 0.0 | 0.0 | 0.0 | 42 | 42 | 0.80 | 33 | |
| 1 | 8.3 | 13.3 | 6.6 | 6.6 | 247 | 247 | 0.80 | 197 | |
| 2 | 131.0 | 322.2 | 161.1 | 161.1 | 5,031 | 5,031 | 0.80 | 4,025 | |
| 2 | 0.5 | 1.6 | 0.8 | 0.8 | 23 | 23 | 0.80 | 18 | |
| 2 | 33.1 | 91.8 | 45.9 | 45.9 | 1,376 | 0.50 | 688 | 0.80 | 550 |
| 3 | 38.4 | 76.2 | 38.1 | 38.1 | 1,290 | 1,290 | 1.00 | 1,290 | |
| 3 | 39.7 | 74.3 | 37.1 | 37.1 | 1,288 | 1,288 | 1.00 | 1,288 | |
| 3 | 222.3 | 675.5 | 337.7 | 337.7 | 9,844 | 0.85 | 1,477 | 1.00 | 1,477 |
| 4 | 52.9 | 103.9 | 52.0 | 52.0 | 1,767 | 1,767 | 1.00 | 1,767 | |
| 4 | 137.8 | 395.8 | 197.9 | 197.9 | 5,870 | 0.85 | 881 | 1.00 | 881 |
| 5 | 25.3 | 69.1 | 34.6 | 34.6 | 1,042 | 1,042 | 1.00 | 1,042 | |
| 5 | 65.4 | 215.6 | 107.8 | 107.8 | 3,067 | 0.85 | 460 | 1.00 | 460 |
| 6 | 1.3 | 0.0 | 0.0 | 0.0 | 18 | 18 | 1.00 | 18 | |
| 6 | 18.3 | 45.4 | 22.7 | 22.7 | 707 | 707 | 1.00 | 707 | |
| 6 | 233.5 | 587.0 | 293.5 | 293.5 | 9,099 | 0.85 | 1,365 | 1.00 | 1,365 |
| TOTALS | 1077.0 | 2808.6 | 1404.3 | 1404.3 | 42,990 | 18,605 | 16,942 |
Other Nitrogen Sources
There are some minor NPDES discharges, and some landfills that were not incorporated into this analysis.
Nitrogen Loading and Land Use Spreadsheets
Below is a summary of attenuated watershed loading from some key land use features and watershed, using the various loading assumptions described above. It includes some approximations, but can be used to compare to other nitrogen loading estimates. Note that because parcel size is so small in parts of the watershed, a smaller average lawn sizes was used in these subwatersheds, and in some cases even these values may be high.
| lbs/acre= | 10.7 | 10.7 | 0.45 | 4.5 | 9.1 | 20.5 | 23.8 | 4.7 | ||||
| Subwatershed Landuse (values in acres unless specified) | SUB ID | Land+ Estuary Acres | estuary acres | freshwater acres | Land (inc FW) Acres | natural landscp acres | pasture acres | cropland+ orchard acres | cranberry acres | golf courses | No. of Buildings (for lawns) | lawn size (sq dt) |
| New Bedford Reservoir | 1 | 4752 | 0.0 | 151.9 | 4752.0 | 4008.1 | 56.6 | 30.2 | 222.6 | 125.2 | 972 | 5000 |
| Upper Acushnet River | 2 | 6495 | 2.9 | 18.0 | 6492.1 | 5431.7 | 378.5 | 56.5 | 24.2 | 0.0 | 3325 | 5000 |
| Middle Acushnet River | 3 | 3389 | 195.1 | 17.0 | 3193.9 | 1539.9 | 3.3 | 23.8 | 1.2 | 0.0 | 6965 | 3000 |
| Lower Acushnet River | 4 | 2079 | 256.1 | 3.7 | 1822.9 | 941.1 | 9.8 | 2.2 | 0.0 | 0.0 | 4035 | 2000 |
| Inner New Bedford Harbor | 5 | 846 | 228.0 | 0.0 | 618.0 | 189.9 | 0.0 | 0.0 | 0.0 | 0.0 | 1479 | 1500 |
| Outer New Bedford Harbor | 6 | 1934 | 293.4 | 0.0 | 1640.6 | 523.0 | 0.0 | 0.0 | 0.0 | 0.0 | 6734 | 1500 |
| Grand Total | 19495 | 975.5 | 190.6 | 18519.5 | 12633.8 | 0.0 | 0.0 | 248.0 | 125.2 | 23510 | ||
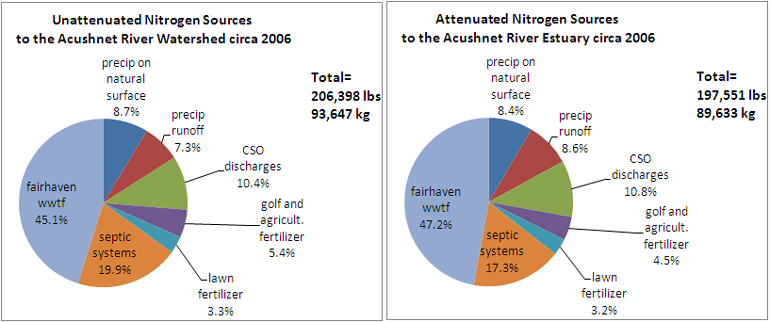
This table shows annual nitrogen loading data (circa 2006, in pounds) in a more summarized form as presented in the pie chart below. The current annual total presented here of 197,594 lbs per year is 20% lower that the value cited in EPA’s draft permit fact sheet (=310 kg/day or 249,382 pounds annually)
| Subwatershed Loading (values in lbs unless specified) | SUB ID | precip on natural surface | precip runoff | CSO discharges | golf and agricult. fertilizer | lawn fertilizer | septic systems | Fairhaven wwtf | attenuated total | % of total |
| New Bedford Reservoir | 1 | 2,673 | 2,054 | 0 | 6,450 | 420 | 9,515 | 0 | 21,112 | 10.7% |
| Upper Acushnet River | 2 | 1,997 | 4,594 | 3,664 | 2,158 | 1,435 | 18,339 | 0 | 32,186 | 16.3% |
| Middle Acushnet River | 3 | 2,953 | 4,055 | 12,150 | 256 | 2,255 | 5,851 | 0 | 27,520 | 13.9% |
| Lower Acushnet River | 4 | 3,189 | 2,647 | 3,126 | 64 | 871 | 192 | 0 | 10,088 | 5.1% |
| Inner New Bedford Harbor | 5 | 2,516 | 1,502 | 77 | 0 | 239 | 144 | 0 | 4,478 | 2.3% |
| Outer New Bedford Harbor | 6 | 3,363 | 2,089 | 2,376 | 0 | 1,090 | 144 | 93,148 | 102,211 | 51.7% |
| Grand Total (lbs) | 16,690 | 16,942 | 21,393 | 8,928 | 6,309 | 34,184 | 93,148 | 197,594 | 100.0% | |
| percent of total | 8.4% | 8.6% | 10.8% | 4.5% | 3.2% | 17.3% | 47.1% | 100.0% |
This pie chart is based on 2006 conditions. The nitrogen loading from the wastewater facility has declined somewhat in the past two years. For septic loading, a water use of 166.7 gpd (x 90% to adjust for non-wastewater use as per MEP methodology) was used in the calculation.
Sensitivity Analyses
As noted above, there is uncertainty as to whether the substantially higher water use on properties served by septic systems reflects higher wastewater discharge (i.e. higher occupancy), or merely reflects that on average, properties with septic systems on average have high water use associated with lawns and pools. To address these uncertainties, different water use values are used in the graph below to show how septic loading in the watershed changes with different assumptions.
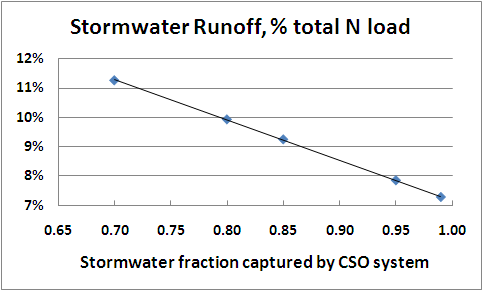
Similarly, there is uncertainty about the percent of stormwater in New Bedford captured by the city’s Combined Sewer Overflow (CSO) system. In other words, most stormwater from New Bedford impervious areas, during small rainfalls, flows to the City’s sewage treatment facility outside the harbor. In heavier rains, some flow is discharged to overflow pipes in the harbor during (which were accounted for by the MEP as per the CSO discharge column in the table above). However, some unknown fraction of impervious area in New Bedford discharges to stormwater-only pipes, even during light rains, which discharge directly into the harbor (see this map). The graph below shows how loading from stormwater only discharges may change depending on what fraction of impervious area is serviced by the CSO system (70% to 99%) as compared to these stormwater only discharges. For the analysis, we assumed that 90% of the impervious area of the lower three segments of the New Bedford portion of the harbor watershed is captured by the CSO system. If, for example, 99% of the impervious area of New Bedford was served by the CSO system, and only 1% was served by a stormwater-only drainage system, the contribution of stormwater to harbor loading would decrease from 8.6% to 7.3%. It does not decrease to a lower value because a large fraction of the impervious area in the watershed is found in the Towns of Fairhaven and Acushnet. Neither Acushnet nor Fairhaven have a CSO system.
Embayment area, bathymetry, and tidal range
This data was developed in the 1990s by the Buzzards Bay NEP.
| Embayment | Water area km2 | mean depth at MLW (m) | mean depth (m) at Half Tide | Vol. at MLW m3x10^6 | Vol. at Half Tide m3x10^6 | Tidal Range(m) |
| New Bedford Harbor (Acushnet River) | 3.85 | 3.53 | 4.13 | 13.6 | 15.91 | 1.2 |
BBNEP GIS Data and Loading Spreadsheet
Parcels (joined to assessors, sewer account, and water account data): acush_parc_3dec2010.zip (6.2 MB). Includes small modifications to data set not yet reflected on this pages loading summary (for example, septic systems count in Acushnet declined by 31, watershed border parcels more comprehensively identified, billing square feet changed to total building area for Acushnet).
BBNEP December 2009 protected open space coverage: bbnep_openspace_dec09.zip (factored into the parcel coverage with some modifications).
New Bedford Harbor watershed: acush_riv_1shed_16jul10.shp.zip
Subwatersheds: acush_riv_sheds_16jul10.zip (includes draft attenuation coefficients)
EOT Road Impervious: eotroads09p_acuriv_16jul10.zip
Parcel Impervious: imprv_acushriv_parconly_16jul10.zip
MassGIS 2005 Landuse: landuse2005_acushnet_bbp_dissolved.zip (used to by the BBNEP calculate golf, and agriculture, except cranberry)
Cranberry Bog Coverage 1: cranberry_bogs_coverage1.zip a simplified SE Mass cranberry bog growing area coverage
BBNEP Cranberry Bog Coverage: cranberry_bogs_semass_ac.zip a simplified SE Mass cranberry bog growing area coverage derived from DEP’s MassGIS WCP coverage.
Please review this loading spreadsheet that was used for this webpage: bbnep_nload_acushnet_5nov2010.xlsx
Links to more information
Mass Estuaries Project Page for New Bedford Harbor
Buzzards Bay Coalition: Interactive WQ Maps
Buzzards Bay Coalition Inner New Bedford harbor Water Quality Trends, 1993-2003
Buzzards Bay Coalition Baywatchers III poster
Buzzards Bay Coalition Baywatchers 1992-2005 Water Quality Atlas
Buzzards Bay landfill sites 2007 DEP MassGIS data as a Google Earth File; click on polygon for more info
Please report errors or send comments about this page to Joe Costa.
