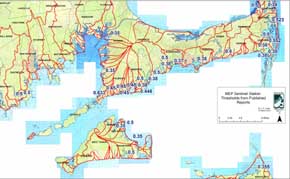
Summary of MEP Sentinel Station Information
Related Pages: Nitrogen Management Origins | N-Loading Assumptions
Map of MEP stations click image to enlarge. Or better yet, open the Google Earth files, or use the ArcGIS shapefile below.
Google Earth file: mep_sentinel_public_2012_bbnep.kmz
Zipped ArcGIS shapefile: mep_stations_thresholds.zip
Source of Data
Only data contained in draft and final TMDL reports published at the MEP, DEP, EPA, or other publicly available websites are displayed on this page. For the most part, the US EPA has accepted these reports and values specified to establish TMDLs for those estuaries. MEP reports are available at these links:
MEP Oceanscience.net
DEP TMDLs
EPA Approved TMDLs in MA
Town of Chatham Page
Town of Orleans Page
Edgartown Report at the Martha Vineyard Commission
Reports posted by Town of Barnstable
Lagoon Pond Study posted on the MV Times
Estuary TMDL and Sentinel Target Concentrations
| Estuary System | Existing watershed load (kg/d) |
Recommended watershed load (kg/d) |
Percent watershed reduction to meet TMDL |
Sentinel station target as modeled (mg/l)* |
| Sentinel stations with target concentrations to primarily restore eelgrass habitat | ||||
| Little River | 4.69 | 4.69 | 0% | 0.349 |
| Lagoon Pond | 46.8 | 30.62 | -35% | 0.352 |
| Phinneys Harbor System | 29.3 | 19.25 | -34% | 0.352 |
| Sengekontacket Pond | 37.57 | 30.28 | -19% | 0.353 |
| West Falmouth Harbor | 41.74 | 18.53 | -56% | 0.353 |
| Nantucket Harbor | 23.41 | 16.69 | -29% | 0.358 |
| Slocums River | 136.09 | 102.02 | -25% | 0.364 |
| Centerville River System | 132.2 | 95.43 | -28% | 0.372 |
| Lewis Bay System | 133.91 | 97.82 | -27% | 0.38 |
| Popponesset Bay | 69.11 | 37.95 | -45% | 0.38 |
| Three Bays System | 130.76 | 70.25 | -46% | 0.38 |
| Hamblin Pond | 10.37 | 1.58 | -85% | 0.38 |
| Sulphur Spring System | 24.52 | 19.63 | -20% | 0.381 |
| Taylors Pond | 10.78 | 5.19 | -52% | 0.381 |
| Stage Harbor System | 28.88 | 9.19 | -68% | 0.382 |
| Great Pond (Falmouth) | 53.01 | 19.71 | -63% | 0.404 |
| Quashnet River | 25.95 | 10.99 | -58% | 0.418 |
| Green Pond | 22.36 | 10.16 | -55% | 0.421 |
| Jehu Pond | 7.24 | 1.88 | -74% | 0.446 |
| Little Pond | 19.07 | 5.36 | -72% | 0.449 |
| Farm Pond | 5.97 | 4.39 | -26% | 0.453 |
| Bournes Pond | 14.95 | 3.55 | -76% | 0.454 |
| Sentinel stations with target concentrations to primarily restore benthic habitat | ||||
| Great Pond (Edgartown) | 30.28 | 21.06 | -30% | 0.5 |
| Rock Harbor | 9.07 | 3.72 | -59% | 0.5 |
| Oyster Pond (Falmouth) | 4.47 | 3.15 | -30% | 0.633 |
| Rushy Marsh Pond | 0.45 | 0.09 | -79% | 0.99 |
| Namskaket Creek | 12.69 | 45.89 | none | 1 |
| Little Namskaket Creek | 7.71 | 12.74 | 65% | 1 |
| Halls Creek | 23.13 | 36.26 | 57% | 1 |
| Sesachacha Pond | 0.97 | 0.97 | 0% | 1 |
* Threshold target concentrations may be rounded to 2 significant digits in Executive Summaries or in the body of reports. Values shown are as presented in model tables, generally found in section VIII of the reports. Some reports have modeled TN concentrations to four significant digits. Mg/l is equivalent to parts per million (ppm).
Comments about this page should be directed to Joe Costa.
