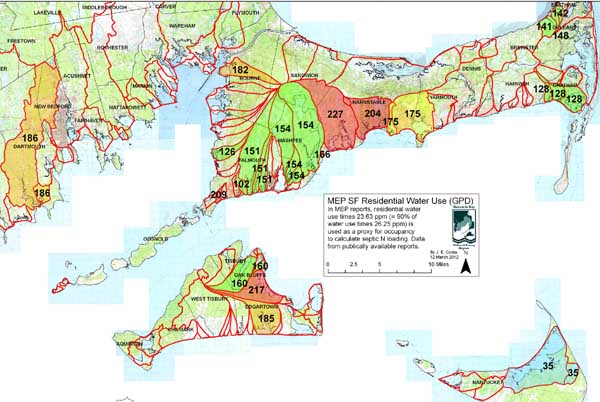
Summary of MEP water use and Residential Onsite (Septic) System Loadings
Related Pages: Nitrogen Management Origins | N-Loading Assumptions |
Source of Data
Only data contained in draft and final TMDL reports published at the MEP, DEP, EPA, or other publicly available websites are displayed on this page. For the most part, the US EPA has accepted these reports and values specified to establish TMDLs for those estuaries. MEP reports are available at these links:
MEP Oceanscience.net
DEP TMDLs
EPA Approved TMDLs in MA
Town of Chatham Page
Town of Orleans Page
Edgartown Report at the Martha Vineyard Commission
Reports posted by Town of Barnstable
Lagoon Pond Study posted on the MV Times
Single Family Home Average Residential Water Use in Model
Due to patterns of weekend and seasonal water use, it is difficult to estimate average annual occupancy in many subwatersheds. US Census estimates of “occupancy” are the occupancy rates of occupied homes, not the occupancy rate of all homes in the watershed. Summer homes and weekend use homes are listed as vacant in US census statistics. To address this problem, the MEP uses annual water use of all properties as a proxy for population occupancy. Average annual water use of all single family homes in a watershed is thus an expression of an annual occupancy of all single family homes in that watershed. These measurements are generally based on municipal water account data when available.
In the table below is the average single family home (SFH) residential water use in each watershed as stated in the publicly available MEP reports in the links above. The data can generally be found in Table IV-3 or thereabouts, in each report. These averages include year round and seasonal and intermittently used units. The third column shows a conceptual annual average occupancy rate of all SFH properties (both Census “vacant” and occupied) if each person used on average 55 GPD (a planning value used in Title 5 regulations).
To calculate septic loadings, the MEP multiplies annual water use by 90% (10% is presumed to be used on average for outdoor uses like pools and lawn watering), times an assumed groundwater discharge concentration of 26.25 ppm. In loading spreadsheets, this may also be equivalently expressed as total water use times 23.625 mg per liter.
| Estuary System | Average SF Residential Water use (gpd) |
conceptual average SFH annual occupancy |
septic load lbs per SFH |
| Bournes Pond | 151 | 2.75 | 10.87 |
| Centerville River System | 204 | 3.71 | 14.68 |
| Farm Pond | 160 | 2.91 | 11.52 |
| Great Pond (Edgartown) | 185 | 3.36 | 13.32 |
| Great Pond (Falmouth) | 151 | 2.75 | 10.87 |
| Green Pond | 151 | 2.75 | 10.87 |
| Lagoon Pond | 160 | 2.91 | 11.52 |
| Lewis Bay System | 175 | 3.18 | 12.60 |
| Little Pond | 102 | 1.85 | 7.34 |
| Nantucket Harbor | 35 | 0.64 | 2.52 |
| Oyster Pond (Falmouth) | 209 | 3.80 | 15.04 |
| Phinneys Harbor System | 182 | 3.31 | 13.10 |
| Popponesset Bay | 154 | 2.80 | 11.09 |
| Rock Harbor | 142 | 2.58 | 10.22 |
| Sengekontacket Pond | 217 | 3.95 | 15.62 |
| Slocums River | 186 | 3.38 | 13.39 |
| Stage Harbor System | 128 | 2.33 | 9.21 |
| Sulphur Spring System | 128 | 2.33 | 9.21 |
| Taylors Pond | 128 | 2.33 | 9.21 |
| Three Bays System | 227 | 4.13 | 16.34 |
| West Falmouth Harbor | 126 | 2.29 | 9.07 |
| Hamblin Pond | 154 | 2.80 | 11.09 |
| Namskaket Creek | 141 | 2.56 | 10.15 |
| Little Namskaket Creek | 148 | 2.69 | 10.65 |
| Rushy Marsh Pond | 166 | 3.02 | 11.95 |
| Jehu Pond | 154 | 2.80 | 11.09 |
| Little River | 186 | 3.38 | 13.39 |
| Halls Creek | 175 | 3.18 | 12.60 |
| Sesachacha Pond | 35 | 0.64 | 2.52 |
| Quashnet River | 154 | 2.80 | 11.09 |
Additional notes: There are some variations as to how the MEP calculates SFH water use, and it is not always the sum of individual water use of accounts in a watershed. For example, in the Slocums River report, the 188 gpd per SFH for the Town of Dartmouth was based on an estimate from the water department of average water use for all single family homes in the entire town, not just the average of homes in the Slocums River watershed.
Click on the map to enlarge. Data from the publicly available reports in the links above.
Comments about this page or suggested corrections should be directed to Joe Costa.
