Use of a Geographic Information System to estimate nitrogen loading to coastal watersheds
J.E. Costa1, D. Janik1, N. MacGaffey1,2, and D. Martin1
March 2, 1994
Buzzards Bay NEP Technical Report
1 Buzzards Bay NEP, Massachusetts Coastal Zone Management, 2 Spring St., Marion, MA 02738
2 current address: Boston Gas Company
Summary
The Buzzards Bay NEP, a participant in the U.S. Environmental Protection Agency’s National Estuary
Program, has developed a management strategy to protect and restore water quality and living resources
in Buzzards Bay embayments from excessive inputs of nitrogen from human activities. The
implementation of this strategy requires an evaluation of existing and potential future inputs of
anthropogenic nitrogen from sources within each embayment’s drainage basin, to determine if existing or
future inputs will exceed recommended nitrogen loading limits. Such an approach requires an evaluation
of each parcel of land within the drainage basin to determine the number of existing housing units and
future development potential based on local zoning regulations. In this way, existing and potential future
“non-point sources” of nitrogen can be determined.
Because a parcel level land use analysis within a drainage basin can be somewhat costly and time
consuming, a simplified GIS land use evaluation process was developed to determine which embayments
are most likely to require nitrogen controls. This “first-cut” analysis of nitrogen loading was based on an
evaluation of land use data and U.S. Census data stored in the Massachusetts Geographic Information
System (MassGIS). The land use database was derived from 1:25,000 scale photographs.
Because, in most cases, the majority of anthropogenic nitrogen added to Buzzards Bay embayments is
derived from on-site sewage disposal systems, reasonable estimates of nitrogen loading from land use
requires good algorithms to predict housing units. Such a relationship was defined empirically for the
four MassGIS residential land use categories that could be used to predict housing units for nearly all
subbasins around Buzzards Bay. Once the number of housing units were calculated, loadings from septic
systems, lawns, and impervious surface were estimated using standards adopted by the Buzzards Bay
Project and US Census occupancy rate data. Loading rates for non-residential land use were adopted
from literature sources.
Introduction

The Buzzards Bay NEP proposed that local, regional, and state authorities adopt nitrogen
loading rate limits to protect Buzzards Bay’s more than 30 major coastal embayments from excessive
inputs of nitrogen (EPA and EEA, 1991). It was suggested these limits be based on either tiered limits
that incorporate the bathymetry of the receiving waters, hydraulic turnover times, and existing water
quality classifications, or be based on some other appropriate site specific scientific information. These
nitrogen loading rate limits would be used to establish embayment-specific total maximum annual loads
(TMALs) for anthropogenic nitrogen from the surrounding drainage basin (Fig. 1).
To implement the Buzzards Bay NEP’s management strategy, it is necessary to determine whether
nitrogen loading to an embayment’s drainage basin currently exceeds the embayments recommended
maximum annual nitrogen load, or has the potential to exceed this annual load when the drainage basin
reaches its full “build-out” potential. This process requires an evaluation of nitrogen loadings from both
point source and nonpoint source discharges. The nonpoint source nitrogen loadings would be evaluated
by performing a land use analysis on each individually
owned parcel of land in the surrounding drainage basin.
Point source loadings would be quantified from state
and federal discharge permits to surface or groundwater.
Although more than 50% of the nitrogen to Buzzards
Bay as a whole is discharged by point sources,
principally municipal wastewater treatment facility
outfalls, in most Buzzards Bay embayments, non-point
sources of nitrogen, especially from on-site wastewater
disposal systems (septic systems) and fertilizer used on
lawns, golf courses, and agricultural land (Kelly et al.,
1992; SAIC, 1992) are the principal source of nitrogen.
For example in Buttermilk Bay, a typical Buzzards Bay
embayment, septic systems alone accounted for more
than 70% of anthropogenic nitrogen loading (Horsley
Witten and Hegemann, 1991).
Because the parcel level land use analysis that is required to evaluate non-point sources of nitrogen
loading within each Buzzards Bay subdrainage basin is somewhat costly and time consuming, a
simplified land use evaluation process was developed to determine which embayments are most likely to
require management action to control nitrogen. This “first-cut” analysis of nitrogen loading was based on
an evaluation of land use data and U.S. Census data stored in the Massachusetts Geographic Information
System (MassGIS). The land use database was derived from 1:25,000 scale photographs.
Methods
Land use within 30 Buzzards Bay sub-drainage basins was derived from the Commonwealth of
Massachusetts MassGIS Project which employs ARC-INFOTM software. The land use data was compiled
by interpreting 1:25,000 scale color infra-red aerial photographs taken in 1984. Features as small as 0.4
ha (1 acre) were interpreted and classified as one of 21 possible land use categories. Among these land
use classifications were three agricultural land use categories and four residential categories. The four
residential categories were “multi-family” (R0, generally large apartment or condominium complexes),
lots smaller than ¼ acre (R1), lots ¼ to ½ acre (R2), and lots greater than ½ acre (R3). Figure 2 shows
MassGIS land-use for the Buttermilk Bay watershed, grouped into seven categories for clarity.
For most of these land-use categories, we used nitrogen loading rates typical for that land use from
published data and other assumptions described below and elsewhere (see EPA and EEA, 1991; Costa
et al., 1993). Most of our effort, and the focus of this paper, is the estimation of dwelling unit and
population density within the four residential land use categories because, as noted above, it is believed
that residential land use accounts for the majority of nitrogen inputs to most Buzzards Bay embayments.
Once the housing unit densities were calculated, we applied assumed loading rates for septic systems,
lawns, and impervious surfaces that were adopted by the Buzzards Bay NEP (EPA and EEA, 1991).
To estimate housing unit density for the four residential land use categories, we counted residential
structures (usually single family homes) within randomly selected polygons for each of the four
residential land use categories on the GIS system. Residential structures were counted on either USGS
1:25,000 scale quad sheets (photo updated 1972 or 1979), 1981 color photographs, or 1990 black and
white orthophotographs. Because the land use evaluation was based on 1984 photographs that were not
available for this study, quad sheets were used only to estimate housing unit densities where there
has been little new construction between the time the maps were prepared and 1984. Counts from the
1981 and 1990 photographs were sometimes interpolated. We assumed each house counted was a single
family unit (US Census data suggests that in most Buzzards Bay towns, 80% of the dwellings are single
family units).
Once the number of units in a subbasin was estimated using the MassGIS land use data, we multiplied
this number by the occupancy rate for that subbasin as estimated from US Census data to obtain existing
subbasin populations. It was possible to estimate the occupancy rate specific for each embayment
subbasin from the U.S. Census data because some of the Census data had also been incorporated into the
MassGIS system. Both U.S Census population “block” and housing unit “block group” aggregate
polygons have been digitized and registered with the land use data. Within the Buzzards Bay drainage
basin, approximately 9,759 population blocks are defined. Since the population of the Buzzards Bay
basin is approximately 235,000, this suggests a mean regional block density of 24.0 people. For those
blocks that crossed watershed boundaries, we developed an algorithm to divide populations within the
block proportionally to the area of the polygon within each subbasin. Approximately 19% of the
population blocks were bisected by at least one subbasin boundary.
The process for estimating the number of housing units from the U.S. Census data was somewhat more
complicated because the “block group” polygons are large. There are only 350 block group aggregates in
the Buzzards Bay basin, but nearly 59,400 housing units, so each block group has an average of 170
units. Since most of these block groups cross at least one subbasin boundary, potential errors would be
introduced by assuming housing units densities were uniform over the block group aggregate. To adjust
for this source of error, we first estimated the ratio of population of the block group in the basin vs the
total for the entire block group. This ratio was than multiplied by the total number of units in the block
group to obtain the units of that block group in the subbasin. Errors can be introduced by this
methodology if occupancy rate is not uniform over the block group polygon, but overall we felt this
approach resulted in the best possible estimates using the available information.
Because some early estimates of nitrogen loading developed by the Buzzards Bay NEP were based on
a set of a priori assumptions relating to unit density in the four residential land use categories, these a
priori assumptions are described. To evaluate the validity of the estimates of numbers of units and
population derived from the land use data (using both a priori assumptions and empirical measurements
of housing densities), we compared our estimates of dwelling units and population in each subbasin to
U.S. Census data, both in town and subwatershed comparisons.
To estimate 1984 units within town boundaries from the U.S. Census statistics, the 1980 and 1990
Census unit data were interpolated. For the embayment level drainage basin comparisons, only 1990
U.S. Census statistics for units and population were available on the GIS system and so only these data
were compared to estimates from MassGIS land use. To demonstrate how the loading constants
described here can be applied to the MassGIS land use data, we report the annual loading of nitrogen to
28 of 31 Buzzards Bay embayments.
Embayments that included land use within the city of New Bedford were not included in this report
because its pattern of development older urban/industrial development consist of very small lots with
many multi-level dwellings is atypical of the remaining 85% of the Buzzards Bay drainage basin which
consists mostly of suburban single family dwellings, mostly on lots 1/3 acre or larger. Also, New
Bedford and urban areas like it do not lend themselves to this nitrogen loading analysis because
wastewater and stormwater are collected in the sewer system and discharged through outfalls.
We have adopted in our analysis of MassGIS land use data, where possible, the loading assumptions
adopted for the Buzzards Bay NEP’s parcel level land use analysis (see Costa et. al., 1994) including
contributions of nitrogen from septic systems, lawns, and impervious surfaces. Below we describe our
assumptions on how we translated the MassGIS data into meaningful loading rates, including any
variances in our previous assumptions.
Results
Calculating units and population from residential land use
A priori assumptions vs empirical observations
Actual lot size vary widely in the four residential GIS land use categories. In practice, lots most typically
conform to minimum lot sizes defined in zoning regulations, the most common of which are 10,000,
15,000, 20,000, 30,000, 40,000 (“1 acre zoning”), 60,000 and 80,000 ft2. During the past two decades,
there has been a trend to increase minimum lot size, and most zoned unsubdivided areas rarely have
minimum lot sizes less than 20,000 ft2.
Previously, the Buzzards Bay NEP used a set of a priori assumptions to estimate unit density for the
four residential land use categories. For R3 (lots greater than ½ acre), we presumed a 40,000 ft2 typical
lot size, for R2 (¼ to ½ acre lots) we presumed 20,000 ft2 lots typical, and for R1 (<¼ acre lots) mostly
areas developed more than 30 years ago, we presumed 10,000 ft2 lots are most typical. For multi-family
classified land-use (R0) we presumed five units per acre. Because the land use classification system did
not account for roads, we assumed the land area required for infrastructure such as roads, sidewalks (or
road easements), and other non-lot land uses averaged 15% of the polygons for the R1 classifications,
and 10% for the two larger lot size land use categories (R2 and R3). These infrastructure percent cover
values are often used by planners (e.g. Horsley Witten and Hegemann, 1990). The resultant unit
densities for the four residential land use categories using the a priori assumptions are shown in Table 1.
Table 1. A priori assumptions of resultant unit density in MassGIS residential land use categories.
MassGIS assumed
residential typical lot % infra- density
category size (sq. ft.) structure (units/ac)
R0: “multi-family” NA NA 5.0
R1: “smaller than ¼ acre lots” 10,000 15 3.7
R2: “¼-½ acre lots” 20,000 10 2.0
R3: “larger than ½ acre lots” 40,000 10 1.0
Table 2. Actual mean unit density (± standard error) in GIS residential land use categories in selected GIS
polygons as observed on aerial photographs and other sources.
MassGIS polygon
residential sample density
category size (units/ac±SE)
R1: “smaller than ¼ acre lots” 13 3.75±.37
R2: “¼-½ acre lots” 11 2.19±.27
R3: “larger than ½ acre lots” 62 1.04±.05
Actual unit densities for residential land use classes R1-R3 were similar (Table 2) to the a priori housing
unit density assumptions and correlated equally well with U.S. Census data (not shown). Consequently
we present only the comparisons of the MassGIS algorithms using the empirically derived housing
densities to the U.S Census data. Multifamily unit densities were not assessed since they represent such
a small portion of the residential development in any watershed.
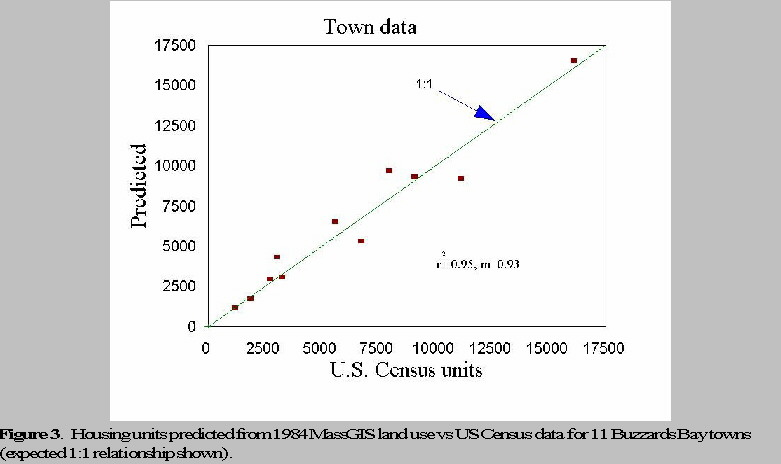
Estimates
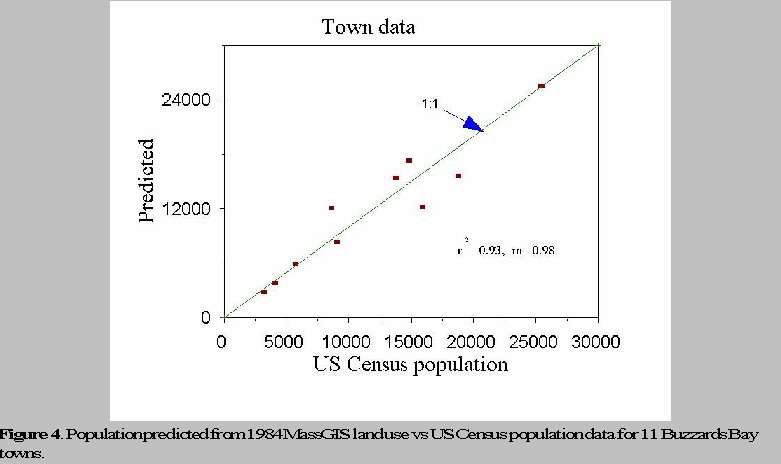
of total town housing units (Fig. 3) and population (Fig. 4) from the MassGIS land use data
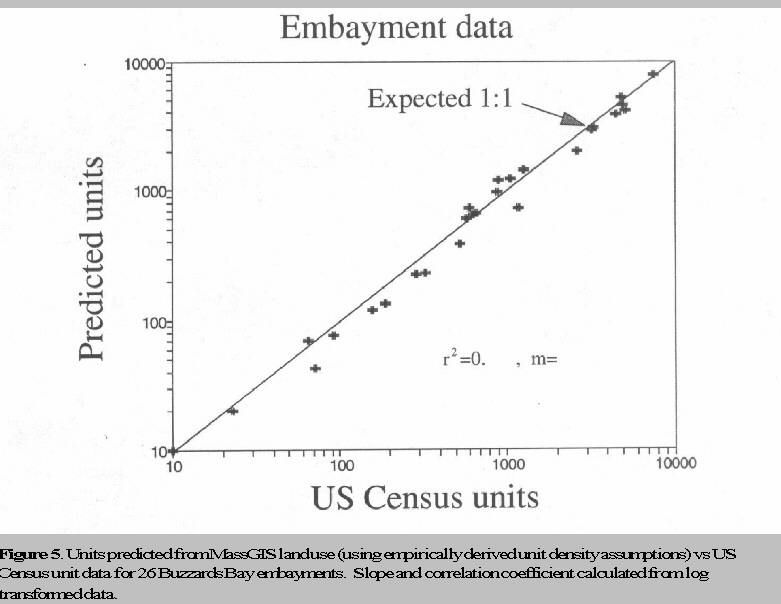
correlated well with U.S. Census data. Estimates of housing units in 26 embayments using MassGIS
data also correlated well with estimates made from U.S. Census data (Fig. 5, note log scale).
Calculating nitrogen from residential land use
Septic systems
For management action, the Buzzards Bay NEP adopted a per capita annual load of 5.9 lb (2.7 kg)
capita-1 and an occupancy rate of 3 persons per unit for all residential land use classes. Actual U.S
Census 1990 occupancy rates (combined rate for both vacant and occupied housing) around Buzzards
Bay ranged from a low of 1.7 persons per unit in Falmouth (“off season” occupancy), a tourist resort that
experiences a 50% increase in population during summer, to a high of 2.7 in Dartmouth. Some towns
have experienced changes in mean occupancy rates over time, and when assessments are conducted to
determine historical inputs of nitrogen, or determine existing nitrogen loads, actual occupancy rates
should be used.
Lawns
We have assumed that lawn size is proportional to lot size, and have used 140, 279, 465, and 465 m2
(1500, 3,000, 5,000, and 5,000 ft2) of lawn sizes per unit for the residential land-use categories R0-R3,
respectively. The Buzzards Bay NEP adopted 29.3 kg N ha-1 (0.6 lb N/1000 ft2) leaching rates for
lawn fertilizer (EPA and EEA, 1993), this equals 0.4, 0.8, 1.4, and 1.4 kg N unit-1 loading rates
respectively for the four residential land use classes.
Developed lot impervious surface
We presume there is typically 46.5 m2 (500 ft2) in driveways and other paved surfaces on lots of single
family homes, and that unpaved impervious surfaces (i.e. roofs) average 140 m2 (1500 ft2). The Buzzards
Bay Project adopted a loading of 7.3 kg N ha-1 (0.15 lb/1000 ft2) for runoff from impervious surfaces on
residential lots, or about 0.14 kg/unit. Contribution of nitrogen from public and private common use road
surface area runoff was calculated separately from residential land use areas.
The potential surface water and groundwater nitrogen loading from the 4 residential land use categories
for the combined inputs from septic systems, lawns, and impervious surface is shown in Table 3.
Road Surface
The MassGIS stores road locations as dimensionless lines. Four road area classes exist, but for
simplification, all were combined, and it was assumed that 8 m (25 ft) was a conservative regional
average of secondary road surface. The Buzzards Bay NEP adopted a loading rate of 15.1 kg ha-1 (0.31
lb/1000 ft2) for runoff from road surfaces.
For each subbasin we calculated total road area which was multiplied by the loading constant for
impervious surface cited above. To illustrate the importance of this contribution, in the Onset Bay
drainage basin (mostly R2 and R3 land use classes) there were 80 km of road for an estimated 2087 units.
This equaled approximately 307 m2 per house or an annual nitrogen load of 0.46 kg per house.
Agricultural lands other than cranberry bogs
Application rates of fertilizers to crops other than cranberries range from less than 10 to more than 100
kg N ha-1. Leaching rates generally increase with increased application rates. A large portion of the
agricultural land in the Buzzards Bay watershed (other than cranberry bog and pasture) is planted with
corn with an application rate 100 kg N ha-1. Assuming a 20% leaching rate, this equals 20 kg N ha-1 as
the groundwater loading rate for this land use category. For pasture we assumed 10 kg ha-1.
Other categories of land-use
Since we presumed that precipitation on vegetated lands like forests, open spaces, etc. was not an
important source of nitrogen reaching groundwater because vegetation is presumed to take up virtually
all bioavailable nitrogen in precipitation, these land uses were assigned a nitrogen loading rate of 0.
Areas that had lawns with potential of fertilization (golf course, baseball fields, etc.) were given the same
loading rate as home lawns (29.3 kg ha-1). For land use categories that lack vegetation (open pit gravel
mines), it was presumed that the loading rate was the same as for impervious non-paved surfaces (e.g.
roof runoff), or 7.3 kg/ha-1. This loading rate was also used to estimate nitrogen loading from deposition,
directly on the embayment. For commercial land use (typically business strips, restaurants, some
apartment buildings, etc.) we assumed as high a loading rate for sewage from the multifamily category
plus the additional input of stormwater since most of the landscape is covered with pavement and roofs.
For industrial, transportation, and waste disposal, we assume the same loading rate as for road surfaces.
Although landfills should be additionally included as a point source in this study, because little data was
available, and there were few landfills in the drainage basins examined, they were not included. A
summary of loading coefficients for all land use categories are shown in Table 3.
In Table 4, we summarize land use for all Buzzards Bay drainage basins evaluated in this study and the
relative nitrogen contribution of each land use category. Also included is the nitrogen load by
precipitation directly on the embayments. As shown, the residential and commercial land use categories
account for 70% of the anthropogenic nitrogen loading to Buzzards Bay embayments.
Table 3. Annual nitrogen loading rates assigned to the 21 land use categories for the Buzzards Bay drainage basin
Category Category Explanation or N loading rate
# Name typical examples (kg ha-1 y-1)
1 Cropland corn, nurseries 20.0
2 Pasture hay, dairy 10.0
3 Forest 0.0
4 Non-forested wetland freshwater marshes 0.0
5 Mining sand and gravel pits 7.3
6 Open land 0.0
7 Participatory recreation golf courses 29.3
8 Spectator recreation baseball diamonds 29.3
9 Water Based recreation beaches 0.0
10 R0:Residential-multi-family condominiums, dormitories 106.5
11 R1:Residential-<¼ acre lots 82.6
12 R2:Residential-¼ – ½ acre lots 46.4
13 R3:Residential->½ acre lots 23.2
14 Salt marsh 0
15 Commercial business districts 121
16 Industrial 15.1
17 Urban open parks 0
18 Transportation interstate highway, medians 15.1
19 Waste disposal landfills 15.1
20 Water freshwater ponds and rivers 0
21 Woody perennial mostly cranberry bogs, some orchards 18.0
NA Embayment surface (atmospheric deposition) 7.3
Table 4. Combined land use statistics and nitrogen loading estimates for 28 Buzzards Bay embayment drainage
basins. (N.B. embayment loading mean percent of total represents the mean contribution for that land use category
in the 28 embayments, not percent of the combined 28 embayment total loading.)
28 embayment
Combined combined mean %
Landuse category area (km2) % of total loading (kg) of total
1 Cropland 3,368 4.0% 67,350 7.6%
2 Pasture 1,582 1.9% 15,820 2.5%
3 Forest 55,106 65.3% 0 0.0%
4 Non-forested wetland 1,870 2.2% 0 0.0%
5 Mining 335 0.4% 2,350 0.3%
6 Open land 2,110 2.5% 0 0.0%
7 Participatory recreation 415 0.5% 12,170 2.5%
8 Spectator recreation 100 0.1% 2930 0.5%
9 Water based recreation 135 0.1% 0 0.0%
10 R0:Residential-multi-family 144 0.2% 15,300 2.7%
11 R1:Residential-<¼ acre lots 1,069 1.3% 88,380 13.4%
12 R2:Residential-¼ – ½ acre lots 3,982 4.7% 206,260 19.9%
13 R4:Residential->½ acre lots 4,103 4.9% 100,920 18.4%
14 Salt marsh 1,702 2.0% 0 0.0%
15 Commercial 517 0.6% 61,990 7.6%
16 Industrial 138 0.2% 2,180 0.4%
17 Urban open 1,195 1.4% 0 0.0%
18 Transportation 1,410 1.7% 21,270 2.2%
19 Waste disposal 181 0.2% 2,860 0.2%
21 Woody perennial (cranberry bogs) 4,872 5.8% 89,165 6.7%
– ROAD Area 2,020 2.4% 30,900 4.7%
– Embayment water area 54 0.1% 39,190 11.0%
TOTALS 84,332 100.0% 761,289 100.0%
Point sources and other inputs
For each Buzzards Bay drainage basin, any known significant point sources of nitrogen, such as from
sewage treatment facilities, were added to embayment total annual loads.
For two embayment drainage basins with a very large number of dairy cows (Westport Rivers and
Nasketucket Bay) the total number of cows were estimated, and was assumed that of the annual nitrogen
load excreted (65 kg N animal-1 yr-1; SCS, 1992), 33% would reach the receiving waters. This export rate
was used because some of the dairy farms in these watersheds are operated as unconfined feed lots, with
animal densities exceeding 5 cows/ac. Under these conditions, sites may be denuded of vegetation so the
potential of overland runoff and contamination of groundwater by nitrogen is more pronounced because
ground cover on many of these farms is greatly reduced, and because many of the farms are near shore or
along tributaries discharging to these embayments, and overland runoff of animal fecal material has been
documented as a source of fecal coliform bacteria in each watershed. These animal livestock loadings
were calculated as a source separate from the land use loadings. For example, a 20 acre dairy farm
(typically pasture) would be considered as a 200 kg N yr-1 agricultural land source. If that farm also had
100 cows, the loading rate from manure from cows would included in our loading assessment as an
addition 6,500 kg source.
Potential Future Development
To calculate future development in each embayment drainage basin, we presume that 50% of the area
defined in the MassGIS “forested land” category is unbuildable because of wetlands(1) or need for
infrastructure, open space, protection of drinking water supplies, etc. The remainder of the forested land
we presume will be built as the residential and commercial/industrial land use classes (categories 10-13,
15-18 on Table 5). We presume that the existing ratio between the area used for residential purposes
(R0-R3, categories 10-13) and the commercial/industrial categories (categories 15-18) will remain
constant. For the residential categories, we presume that new residential development will be
proportional to existing land-use categories R0 (multifamily), R2, and R3. We have omitted the R1 land
class (lots less than 1/4 acre) from this formulation because very rarely are such small lot sizes allowed
today on unsubdivided parcels of land in the Buzzards Bay area. Agricultural land conversion to
residential or commercial industrial land uses were considered in these buildout projections using the
same assumptions as forested land.
Table 5. Comparison of GIS methodology to U.S. Census data and parcel level land use analysis in Buttermilk Bay
GIS US census Parcel
Parameter methodology1 data2 analysis3
Existing units 2772 3314 3049
Population 59614 55755 92556
Buildable land (ac) 4400 NA 4600
Total future units 5329 NA 5316
1 1984 land use using empirically derived unit densities
2 1990 data; dwelling units increased 20% in area between 1980 and 1990
3 1989 parcel evaluation, from Horsley Witten and Hegemann Inc. (1990)
4 assumed an subbasin occupancy of 2.2 persons per housing unit (US Census)
5 population does not account for summer rentals
6 assumed occupancy of 3 persons per housing unit for planning purposes
Table 6. Comparison of GIS methodology to U.S. Census data and parcel level land use analysis in Waquoit Bay
GIS US census Parcel
Parameter methodology1 data2 analysis3
Existing units 4628 in prog. 4116
Population 83614 in prog. NA
Buildable land (ac) 2777 NA 2253
Additional future units 4915 NA
1 1984 land use using empirically derived unit densities
2 1990 data
3 1990 parcel evaluation from Cape Cod Commission
4 assumed a probable occupancy of 1.9 persons per housing unit for area (US Census data)
Table 7. Comparison of GIS methodology to U.S. Census data and parcel level analysis in West Falmouth Harbor
GIS US census Parcel
Parameter methodology1 data2 analysis3
Existing units 725 1180 868
Population 11054 1446.5 NA
Buildable land (ac) 1842 NA NA
Additional future units 1065 NA 982
1 1984 land use using empirically derived unit densities
2 1990 data
3 1990 parcel evaluation from Howes et al., 1992
4 assumed an occupancy of 1.53 persons per housing unit for area (US Census data times 25% adjustment for seasonal occupancy)
5 population does not account for summer rentals
Comparison of GIS methodology to parcel level land use analysis
These estimates of annual nitrogen loads from MassGIS data and U.S Census data are an important
screening tool, but may not be sufficiently accurate to be used as the basis of decisions on zoning and
planning. Instead a parcel level land use analysis may need to be conducted. Nonetheless, even with the
inherent limitation of the assumptions made, the MassGIS data is a good preliminary assessment. In
Tables 5 and 6, we compare estimates of existing and potential future housing units using our GIS
methodology, parcel level analysis, and U.S. Census data for two watersheds.
In the Buttermilk Bay drainage basin, the GIS estimates underestimated existing units by 20%. Part of
the discrepancy is probably due to new development which increased 5% between 1984 and 1990, as
well as the lack of precision in the GIS land use data. For example, there is a large amount of
development around Buttermilk Bay constructed on lots 1/10 to 1/6 of an acre (i.e. effective densities of
5-8 units/acre). Since these areas were classified as “less than ¼ acre” using an effective density of 3.75
units/acre, housing units were underestimated in these polygons.
In estimating future growth potential, our assumptions in the use of the GIS data led to overestimates of
future growth potential in Buttermilk Bay. Although there is good agreement in the unbuilt land area in
the basin, the higher estimate of potential development from the MassGIS data can be accounted for the
fact that large tracts (more than 1700 acres) of land around Buttermilk Bay are classified for tax purpose
as managed forests (silviculture), have conservation easements (public and private open space), or have
other classifications that preclude any development potential. These areas are of course not distinguished
in the MassGIS data set. Because we believe that typically there will not be as large a percentage of land
with its development potential reduced as in the Buttermilk Bay subbasin, we did not change our
assumptions for future growth potential in other drainage basins. On a case by case basis our algorithms
could be adjusted to address special conditions in an embayment.
Application of Methodology
In Appendix A we summarize land use and nitrogen loading for 28 Buzzards Bay embayments. Using
the mass loading estimate methodology described here and preliminary flushing estimates for Buzzards
Bay embayments (ACI, 1993), the Buzzards Bay NEP has conducted a preliminary loading analysis for
approximately 30 Buzzards Bay embayments (in preparation) to determine whether they now exceed, or
will exceed in the future, the nitrogen loading recommendations contained in the Buzzards Bay
Comprehensive Conservation and Management Plan. These results suggest that about half of the
embayments in Buzzards Bay may require management action to control nitrogen. Of course, the
approach described here is a screening tool. Management action should await a parcel-level land use
analysis and better flushing estimates. Ultimately the extent of actions to control nitrogen will be a
management decision based on an evaluation of costs and benefits, and the degree of public support.
References Cited
Aubrey Consulting, Inc. 1994. Determination of flushing rates and hydrographic features of selected
Buzzards Bay embayments. Buzzards Bay Technical Report. 55 pp. Draft
Costa, J.E., B. L. Howes, A. Giblin, and I. Valiela. 1992. Monitoring nitrogen and indicators of nitrogen
to support management action in Buzzards Bay. In McKenzie et al. (eds) Ecological Indicators.
Chapter 6 (29) pp 497-529.
EPA and EOEA (U.S. Environmental Protection Agency and Massachusetts Executive Office of
Environmental Affairs). 1991. Buzzards Bay Comprehensive Conservation and Management
Plan, 8/91 Final. 246pp.
Horsley, Witten and Hegemann, Inc. 1991. Qualification and control of nitrogen inputs to Buttermilk
Bay. Volume 1. Buzzards Bay NEP Technical Report. January 1991. 66 pg.
Howes, B.L., D.W. Bourne, and N.P. Millham. 1992. An assessment of nitrogen loading to West
Falmouth Harbor from the Falmouth Technology Park and other sources. Prepared for the
Falmouth Economic Development and Industrial Corporation. 15pp.
SCS (USDA Soil Conservation Service). 1992. Agricultural Waste Management Field Handbook. (210-AWMFH, 4/92) 150 pp.
1. 1 The MassGIS land use “forest” category (#19) includes forested wetlands, which are largely unbuildable.
Forested wetlands from the state “Wetlands Conservancy Program” maps will eventually be included in the data
base and this will enable better estimates of buildable undeveloped land.