Step-by-step example for the Wareham River Estuary (PART 3)
<< Go Back to Wareham River Watershed Loading Analysis Demo, PART 2
Step 8: Accounting for nitrogen attenuation and groundwater loss terms
For small or simple watersheds, 100% of all nitrogen that is discharged to groundwater might be assumed to reach an estuary. For larger estuaries, perhaps one where precipitation recharge flows down a river that flows into a pond before it discharges to an estuary, an investigator might determine that only 50% of the nitrogen from this “upper watershed” might reach estuary. In fact, in most TMDL studies, the Massachusetts Estuaries Project assumes that when a subwatershed is bounded by a pond or large impoundment, there is is an appreciable loss of nitrogen due to uptake and biological activity in the pond, often with a 50% loss of nitrogen in water transfers from the upper subwatershed to the low subwatershed. If this is the case, the land use loading estimates for the upper watershed above the pond in the spreadsheet are divide by half. However, for some large watersheds, the situation can be more complex involving a complex mosaic of water transfers and nitrogen attenuation. For example, in the Wareham River estuary watershed, the USGS developed a model with 49 subbasins with complex flow pathways (see figure 7 in USGS study; see also metadata information at water.usgs.gov/GIS/metadata/usgswrd/XML/ds451_gwcontrib_areas.xml).
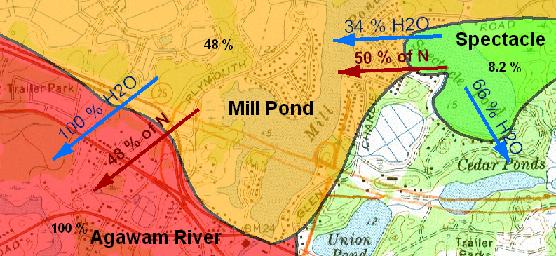
To further illustrate this point, in the Wareham River watershed, suppose a hydrologist concludes that only 34% of the precipitation recharge to Spectacle Pond flows to the Mill Pond watershed, and further, only 50% of the nitrogen in that flow is transferred (50% attenuation; see figure below). With these assumptions, the Spectacle Pond watershed only transfers 17% of its nitrogen to its next downstream subwatershed (Mill Pond). If 100% of the water recharge and flow to the Mill Pond watershed flows downstream to the next subbasin (Agawam River), but only 48% of the nitrogen is conveyed, then only 8.2% of nitrogen from the Spectacle Pond watershed will reach the estuary.

Click image for a larger map, or open this
net nitrogen transmission map as a pdf file
and compare it to this water and nitrogen coefficents map
Now all these complex relationships could be built into a nitrogen loading spreadsheet, but this would make the loading spreadsheet itself quite complex, and make it very difficult to manipulate for different conditions. However, this approach is unnecessary, because no matter how complex the patterns of flow paths and attenuation are, every subwatershed in the Wareham River estuary watershed can be defined by a single nitrogen transmission coefficient to the estuary. These coefficients are estimated simply as the sum of the products of each cascading subbasin series as illustrated in this example:
| net conveyance | subbasin | water transmiss. | nitrogen transmiss. |
| 0.11% | College Pond | 100% | 50% |
| 0.22% | Halfway Pond | 10% | 50% |
| 4.32% | White Island Pond GT10 | 100% | 100% |
| 4.32% | White Island Pond LT10 | 18% | 50% |
| 48.00% | Mill Pond | 100% | 48% |
| 100.00% | Agawam River | 100% | 100% |
The spreadsheet formula in the first “net conveyance” cell in this case is “=product(c2:d$7)”, with this formula dragged down into subsequent cells.
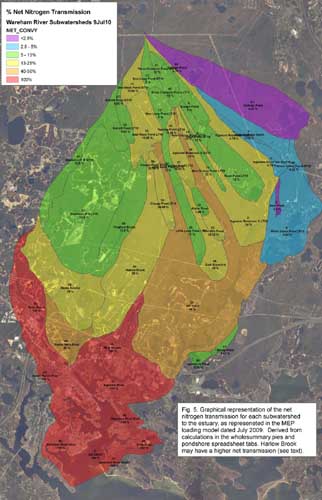
Now if flows are split multiples times, the calculations can be more complex because you have to add up the conveyances for each split, but you are better off calculating these transmission coefficients for each subwatershed at the outset, so that when you calculation all your unattenuated subwatershed loads, you simply multiply these unattenuated loadings by an array (column) of nitrogen transmission coefficients. The outcome of all these calculations using a draft model for the Wareham River estuary can be visualized in the map to the right. Notice that some watersheds in the uppermost portion of the watershed may convey less than 1% of their nitrogen to the estuary. To see how the values in this map were calculated, open this spreadsheet:
net-wareham-n-transmission-calcs.xls
It is worth stressing that the attenuation coefficients for each subwatershed are based on the assumption of a 50% loss of nitrogen in water transfers from one subwatershed to the next, where there is a pond at the subwatershed boundary. It is not based on any specific subwatershed monitoring data, but is rather based on a on the typical nitrogen loss term for such watershed transfers documented on Cape Cod. Although the Wareham River Estuary TMDL is in draft form and is subject to change, we are presenting this graphical representation of the MEP watershed attenuation model here because this nitrogen loading model is being used the developer A. D. Makepeace in their permit applications for two mixed use development projects covering 6,000 acres in the towns of Carver, Wareham, and Plymouth, and by the Massachusetts DEP to evaluate these permits and review nitrogen discharges to groundwater, including a 250,000 gpd groundwater discharge proposed in the Town of Plymouth. This is the most complex water flow and nitrogen attenuation model adopted by the MEP to date.
| Subwatershed Name | ID | Acres | % Net Nitrogen Transmission |
| ESTUARY | 0 | 839 | 100 |
| Agawam Reservoir N GT10 | 1 | 73 | 4.74 |
| Agawam Reservoir S LT10 | 2 | 1,608 | 24 |
| Agawam Reservoir N LT10 | 3 | 189 | 4.74 |
| Agawam River North | 4 | 472 | 3.02 |
| White Island Pond LT10 | 5 | 1,311 | 4.32 |
| Deer Pond | 6 | 50 | 2.2 |
| Fawn Pond LT10 | 7 | 643 | 12 |
| Fawn Pond GT10 | 8 | 176 | 12 |
| Bumps Pond | 9 | 240 | 9 |
| Three Cornered Pond LT10 | 10 | 214 | 12 |
| Three Cornered Pond GT10 | 11 | 59 | 12 |
| New Long Pond GT10 | 12 | 197 | 6 |
| New Long Pond LT10 | 13 | 219 | 6 |
| New Grassy Pond GT10 | 14 | 19 | 12 |
| New Grassy Pond LT10 | 15 | 97 | 12 |
| Agawam Reservoir S GT10 | 16 | 169 | 24 |
| East Head Pond GT10 | 17 | 267 | 13.65 |
| East Head Pond LT10 | 18 | 617 | 13.65 |
| Fearing Pond GT10 | 19 | 48 | 16.59 |
| Mill Pond | 20 | 4,732 | 48 |
| Fearing Pond LT10 | 21 | 282 | 16.59 |
| Abner Pond | 22 | 96 | 7.86 |
| Five Mile Pond | 23 | 147 | 15.72 |
| Little Long Pond GT10 | 24 | 160 | 12 |
| Little Long Pond LT10 | 25 | 313 | 12 |
| East Branch N | 26 | 482 | 24 |
| Barrett Pond GT10 | 27 | 24 | 6.82 |
| Barrett Pond LT10 | 28 | 159 | 6.82 |
| Charge Pond GT10 | 29 | 32 | 20.09 |
| Charge Pond LT10 | 30 | 248 | 20.09 |
| Wankinco R N GT10 | 31 | 699 | 12.5 |
| Wankinco R N LT10 | 32 | 2,642 | 12.5 |
| Frogfoot Brook | 33 | 872 | 12.5 |
| Harlow Brook | 34 | 1,833 | 25 |
| Bog Stream | 35 | 386 | 100 |
| Sandy Pond | 37 | 81 | 9.41 |
| Spectacle Pond | 38 | 83 | 8.16 |
| Maple Swamp | 39 | 1,436 | 25 |
| Parker Mills Pond | 40 | 568 | 50 |
| Rose Brook | 41 | 801 | 100 |
| Agawam River | 42 | 1,696 | 100 |
| Broad Marsh River | 43 | 964 | 100 |
| Wareham River West | 44 | 630 | 100 |
| Wareham River East | 45 | 250 | 100 |
| Crab Cove | 46 | 309 | 100 |
| Wareham River South | 47 | 209 | 100 |
| White Island Pond GT10 | 49 | 111 | 4.32 |
| College Pond | 50 | 293 | 0.15 |
| Halfway Pond | 51 | 1,633 | 0.3 |
>> Continue to Wareham River Watershed Loading Analysis Demo, PART 4
<< Go Back to Wareham River Watershed Loading Analysis Demo, PART 2
