Areas Impacted by Bouchard Oil Spill
Impacted Areas
When the Bouchard No. 120 ran hit rocks off Gooseberry Point in Westport, the barge was apparently towed for possibly ten miles before stopping. Transcripts from communication between the vessel and Woods Hole Group Coast Guard station indicate that another tug operator saw a heavy oil slick trailing from the damaged barge. These movements apparently contributed to the fact that the oil was patchily dispersed by the next morning over an area roughly 10 miles long and 2 miles across. Moreover, shifting wind directions and rough seas over the next several days further broke apart the spill, and kept considerable volumes of the oil from making quick landings. All these factors, together with complex patterns of currents in Buzzards Bay contributed to the landing of at least small amounts of oil being dispersed to all corners of Buzzards Bay. Oil and tar balls have been reported as far as Block Island, and Middleton RI.
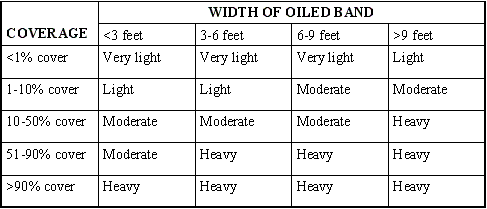
For weeks after the spill, Shoreline Cleanup Assessment Teams (SCAT) scoured the coast, searching for oil, and recording the amount oil landed in terms of width, thickness and cover on shore. This information was used to direct where cleanup crews needed to focus their attention. What criteria were used to establish the degree of oiling (“Heavy,” “light,” etc.) by the Command Center? The table below (or an approximation of it) was used.

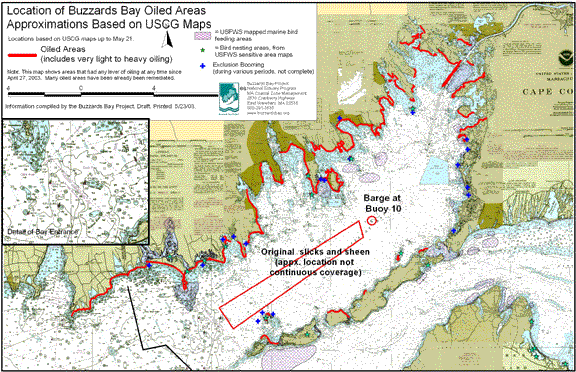
By the end of May, the Coast Guard had estimated that 94 miles of shoreline have had some degree of impact (any degree of oiling). However, the mileage of coastline subject with sporadic oiling is nearly equal to this length between the two states. However, it must be recognized that most areas identified as impacted on the maps below actually have little or no oil, and impacts to shore are very uneven. Often oil came ashore affecting 100s of feet of a portion of beach, but areas on either side of this impacted area may have virtually no oil. Furthermore, oil landed typically in very narrow strips, so the actual acreage of oiled shoreline is quite small.
Most areas, excluding some of the heaviest oiled rock and cobble sites, have been cleaned passed the IRAC cleanup goals. Go to our cleanup status maps for the September update.
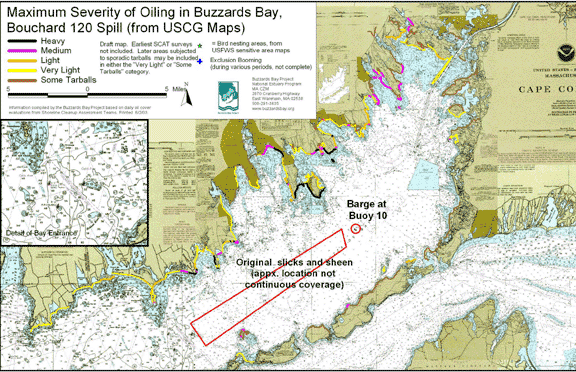
Below we show the maximum extent of oiling map produced by the Buzzards Bay NEP in May, and the degree of oiling map developed by the Buzzards Bay NEP in mid June. These maps were based on “live maps” and survey team information collected by the Command Center when it was operational. Currently State and Federal officials are reviewing all field notes and other information to generate a final affected areas map. This map will be used by governmental officials to establish fines and fees levied as part of the Natural Resource Damage Assessment.
The map above corrects some earlier omissions, but shows only any degree of oiling, from very light (including areas subjected to later sporadic tar balls or “trace” amounts) to heavy.
To better communicate the degree of oiling, we prepared the map below, which shows the maximum extent of oiling at any site since the spill on April 27. This map is not the official impacted area map and includes re-oilings and later subsequent tar balls. It also does not include SCAT survey results before May 5, and some areas may have been more severely oiled than shown.
As of May 27, the Coast Guard lists 93.3 miles affected with some degree of oiling. This total includes areas that received even occasional tar balls several weeks after the original spill. Our own independent estimate from the SCAT maps, we calculated 97.6 miles. The new draft NRDA impacted area maps show a somewhat greater length of shoreline affected. For pragmatic reasons, all these maps include segments of the coast that were never oiled. This is particularly true on the IRAC cleanup maps which show affected coastline length in Buzzards Bay as 190 miles.
The data table below shows the total miles of shoreline with the maximum intensity of oiling, and broken down by town, based on our own June 17 map. We will update this information as we analyze the new NRDA maps.
| Town (miles) | Heavy | Medium | Light | Very Light | Some Tarballs | Grand Total |
| BOURNE | 0.00 | 0.00 | 0.00 | 1.61 | 8.88 | 10.49 |
| DARTMOUTH | 1.67 | 1.38 | 1.39 | 8.24 | 1.43 | 14.11 |
| FAIRHAVEN | 5.11 | 1.37 | 2.63 | 6.78 | 0.75 | 16.63 |
| FALMOUTH | 0.00 | 0.04 | 0.00 | 1.77 | 8.27 | 10.09 |
| GOSNOLD | 0.00 | 0.79 | 0.69 | 2.28 | 9.86 | 13.62 |
| MARION | 0.00 | 5.58 | 0.08 | 1.40 | 7.05 | 14.11 |
| MATTAPOISETT | 2.16 | 1.37 | 4.95 | 7.12 | 2.59 | 18.20 |
| NEW BEDFORD | 0.00 | 0.00 | 0.14 | 1.77 | 3.04 | 4.95 |
| WAREHAM | 0.00 | 1.09 | 2.62 | 8.64 | 9.14 | 21.49 |
| WESTPORT | 0.00 | 0.15 | 3.09 | 4.10 | 0.00 | 7.35 |
| RHODE ISLAND | 0.00 | 0.00 | 0.00 | 8.56 | 0.00 | 8.56 |
| Grand Total | 8.94 | 11.78 | 15.59 | 52.28 | 51.01 | 139.60 |

