Over the years, the Buzzards Bay NEP has awarded millions of dollars in grants to Buzzards Bay municipalities, non-profits, and research organizations. We posted online an interactive map of all grants awarded since 2006. Go to our interactive map of grants awarded page to learn more about these projects. If you click on one of the map symbols, information will pop up about the grant, with links to additional information.
Status & Trends Posts
Workshop on stormwater tool to help identify BMPs and costs
The New England Environmental Finance Center (NEEFC) and the University of New Hampshire Stormwater Center (UNHSC), in cooperation with the Buzzards Bay National Estuary Project, will be hosting a free half-day workshop for municipal staff and officials and their consultants on Tuesday November 14, 1-4 PM in the Town of Wareham (at the Town public library). NEEFC has developed a software tool to help identify, size, and cost out stormwater potential BMP solutions appropriate for municipal watersheds. As noted in the flyer, “This workshop is appropriate for a mixed audience of local staff, municipal consultants, and local officials engaged in stormwater management, at a level accessible to all.”
To register, go to:
Buzzards Bay NEP posts tidal datums for Massachusetts
Over the years, we have received requests from Conservation Commissions and planners to review the accuracy of land and tidal elevations specified on engineering plans submitted with local permit applications. While land surveyors have long-established practices for tying land elevations on a property to local benchmarks, it turns out that tying “tidal datums” like the “high tide line” and “mean high water” (two very different elevations by the way) to land elevations is complicated and nuanced. This is because the real world elevation of tidal datums differs all around Massachusetts, and can even differ appreciably between the upper and lower reaches of a large tidal estuary. Field estimates vary with the lunar and solar cycles, and weather conditions. Exactly where a tidal datum lies on a property can affect the cost of a project, or even whether an activity is permittable under state or local regulations. Disputes over the location of these tidal datums have been the subject of lawsuits about property ownership and regulatory jurisdiction.
Because tying tidal datums to land elevations is complicated, many municipal boards and their staff often accept at face value tidal datums specified on site plans. However, these lines may be wrong, or the elevation definition applied by the surveyor may not match the definition used in an applicable regulation. In Connecticut, the state agencies were so frustrated by inconsistent high tide line elevations reported by surveyors and engineers, the state legislature passed a law defining its own coastal jurisdiction high tide line boundary for municipalities and water bodies in the state (see the CT Coastal Jurisdiction Line Fact Sheet page).
This past summer, CZM’s North Shore regional coordinator, Kathryn Glenn, came to us with a problem. She reported that the chair of a conservation commission complained to her that over the years the commission received plans for coastal projects citing a wide range of elevations for mean high water and the high tide line. The commission was frustrated because they did not understand why the elevations on the plans were different, or how they could objectively evaluate them.
Because we had tackled similar issues in the Buzzards Bay watershed, we decided to do all the calculations necessary to create an interactive tidal datum viewer map of the entire Massachusetts coast to enable anyone to lookup the precise land elevation of any tidal datum in their area. We also added a tidal datum information page to help both specialists and the public understand why these elevations are relevant, and which are used to draw the coastline on maps. To create the viewer, we used tidal data and a tidal datum model from NOAA (VDatum).
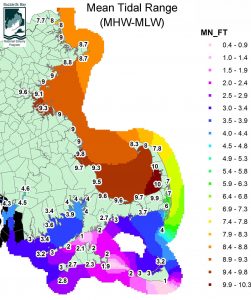
While much of the information on these pages will be of interest only to engineers and regulators, one product of this effort that will be of interest to a broader audience, are the statewide tidal data maps at the bottom of our tidal datum information page, like the one below. Massachusetts, or more specifically, Cape Cod, is at the boundary between the Gulf of Maine tidal regime and an upper mid-Atlantic tidal regime. Because these tidal regimes are offset by about 3 1/2 hours, where the two regimes meet (roughly a line east of Woods Hole through Martha’s Vineyard, to Nantucket), tides are suppressed. This is why, along the Shining Sea Bikeway in Falmouth, the mean tidal range is only 1 foot. In contrast, on the Cape Cod Bay side of Wellfleet, Brewster, and Orleans, the mean tidal range is 10 feet.
These differences in tidal ranges also have profound effects on the kinds and extent of tidal habitats found along the Massachusetts coast, like salt marshes. Generally, salt marshes grow between the high tide line and local mean sea level. To aid scientists studying salt marsh migration using LiDAR data and field measurements, we created a Salt Marsh Lower Boundary page to explain how our tidal datum calculations can be used in studying salt marsh loss and migration in the face of rising sea levels from climate change.
