Broad Marsh River Stormwater Remediation Project
This web page is not a good visual representation of the report. View the Broad Marsh report -PDF version. instead.
BROAD MARSH RIVER
STORMWATER REMEDIATION PROJECT
1993 – 1998
(DEP Project No. 93-01/319)
final report
PREPARED BY:
Bernadette Taber and Joe Costa
THE BUZZARDS BAY PROJECT
in cooperation with
THE NATURAL RESOURCES CONSERVATION SERVICE
On behalf of
THE TOWN OF WAREHAM
PREPARED FOR:
MASSACHUSETTS DEPARTMENT OF ENVIRONMENTAL PROTECTION
BUREAU OF RESOURCE PROTECTION
and
U.S. ENVIRONMENTAL PROTECTION AGENCY
REGION 1
MASSACHUSETTS EXECUTIVE OFFICE OF ENVIRONMENTAL AFFAIRS
Trudy Coxe, Secretary
DEPARTMENT OF ENVIRONMENTAL PROTECTION
David B. Struhs, Commissioner
BUREAU OF RESOURCE PROTECTION
Arleen O’Donnell, Assistant Commissioner
DIVISION OF MUNICIPAL SERVICES
Andrew Gottlieb, Director
final report
July 3, 1998
TABLE OF CONTENTS
Table of Contents i
List of Figures ii
List of Appendixes iv
Acknowledgments v
I. Executive Summary 1
II. Introduction 3
III. Background/History 3
IV. Best Management Alternatives 5
V. Site Assessment, Design and Permitting 7
VI. BMP Implementation 11
VII. Public Participation 13
VIII. Monitoring Methods and Approach 13
IX. Evaluation 16
X. Conclusions 23
XI. References 25
LIST OF FIGURES
Figure 1 Location Map 4
Figure 2 Discharge Map 5
Figure 3 Hen Cove Schematic 6
Figure 4 Precast Galleys Schematic 8
Figure 5 Location of Precast Galleys 9
Figure 6 Plastic Chambers Schematic 10
Figure 7 Location of Plastic Chambers 11
Figure 8 “Upturned” Overflow Pipe 12
Figure 9 Public Display at Wareham Town Hall 13
Figure 10 Location of Infiltration Basin Monitoring Stations 14
Figure 11 Fecal coliform concentrations in stormwater in infiltration basins with adjoining wells. 17
Figure 12 Fecal streptococcus in basin stormwater versus well groundwater concentrations 17
Figure 13 TPH in basin stormwater versus well groundwater concentrations. 17
Figure 14 Comparison of infiltration basin and well samples showing removal of zinc. 18
Figure 15 Comparison of infiltration basin and well samples showing removal of chromium. 18
Figure 16 Comparison of infiltration basin and well samples showing removal of copper. 18
Figure 17 Station 1 fecal coliform concentrations documented by Buzzards Bay NEP. 19
Figure 18 Station 2 fecal coliform concentrations documented by Buzzards Bay NEP. 19
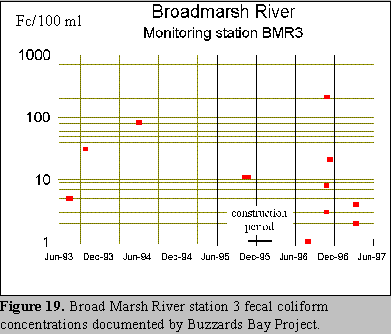
Figure 19 Station 3 fecal coliform concentrations documented by Buzzards Bay NEP. 19
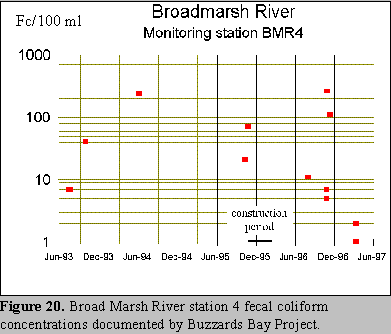
Figure 20 Broad Marsh River station 4 fecal coliform concentrations documented by Buzzards Bay Project. 19
Figure 21 Broad Marsh River station 5 fecal coliform concentrations documented by Buzzards Bay Project 19
Figure 22 Fecal coliform data for DMF Station 7, Pigs Point. 21
Figure 23 Student’s t-test of DMF fecal monitoring at Station 7 22
Figure 24 Data from DMF sampling Station 6 at Pigs Point and Seabreeze Ave 22
Figure 25 Student’s t-test of DMF fecal monitoring at Station 6 23
LIST OF APPENDICES
Appendix A – DMF 1989 Sanitary Survey
Appendix B – Planning Document
Appendix C – Final Design
Appendix D – Order of Conditions
Appendix E – Construction Contract
Appendix F – Public Participation
Appendix G – Monitoring Data
Acknowledgments
This project has been financed partially with Federal Funds from the US Environmental Protection Agency (EPA) to the Massachusetts Department of Environmental Protection (DEP under a 319h Nonpoint Source Competitive Grant. The contents of this report do not necessarily reflect the views and policies of the EPA or of DEP, nor does the mention of trade names or commercial products constitute endorsement or recommendation for use.
We would like to thank Mark Gifford, Director of the Wareham Department of Public Works for his hard work, creativity, and ceaseless energy during this project, and for the support from his staff. We also appreciate the fine leadership by Wareham Administrator Joe Murphy to ensure that this and many other excellent stormwater remediation projects move forward in Wareham.
The Massachusetts Division of Marine Fisheries, especially Greg Sawyer and Frank Germano, provided invaluable guidance to the Buzzards Bay NEP in establishing stormwater remediation priorities, sampling protocols, and in conducting additional sampling in the Broad Marsh River system. Comments on this manuscript were also greatly appreciated.
Thanks also to Tracy Warncke for preparation of some of the graphics in this report.
I. Executive Summary
The Broad Marsh River Stormwater Remediation Project began in 1990 when the town of Wareham requested funding through the Buzzards Bay NEP (BBP) mini-grants program. The Town submitted a proposal to improve the water quality in the lower section of Broad Marsh River through the remediation of stormwater discharges. These discharges showed elevated counts of fecal coliform bacteria during rain storms. The Town, in consultation with the Massachusetts Division of Marine Fisheries (DMF), believed these discharges were a significant contributor to shellfish bed closures in Broad Marsh Rive. In addition, several public and private beaches are located along the river. While these beaches had not been closed due to fecal coliform bacteria, the Town was concerned about the public health risks associated with the stormwater runoff.
Due to limited finances, the Buzzards Bay NEP was unable to provide the funds for the Broad Marsh River Project in 1991. However, in 1992, the Buzzards Bay NEP, in collaboration with the Town of Wareham, submitted a proposal to the Department of Environmental Protection, Office of Watershed Management (the Department), through the S.319 Nonpoint Source Pollution (NPS) program. In June 1993, the Town was awarded $88,450.00 from the Department to remediate the stormwater discharges. In the proposal, the town committed to an additional $71,020.00 contribution as match (cash and in-kind).
In 1993, the BBP and the Town requested planning and technical assistance from the USDA Natural Resources Conservation Service (NRCS). NRCS put together an interdisciplinary team (including engineers, biologists, soil conservationists, a geologist and a soil scientist) to work with BBP and Town representatives to identify alternatives and select best management practices. Several alternatives to reduce the coliform loads from the stormwater runoff were considered. The sandy soils in the project area made infiltration a practicable alternative. Infiltration practices such as trenches and basins were known to be highly effective in removing fecal coliform bacteria from stormwater runoff. Due to land constraints, subsurface (under-the-road) infiltration structures, were selected as the most economically feasible for the town to install.
As part of the Memorandum of Understanding with the Town, NRCS provided the site investigations, survey work and designs needed to implement the project. The design of the infiltration structures went through several revisions before being finalized in April 1995. The extended length of time for needed for completing the designs were the result of considerably less than expected space for infiltration basins due to the narrowness of the roads and the configuration of the many utilities under the road. This forced a reevaluation of infiltration targets and policies by the Buzzards Bay NEP, NRCS, and the town.
In October 1995, the Town awarded the construction contract to C. C. Construction. Construction began in November in the Pinehurst Beach section. Installed were two types of infiltration structures, concrete galleys and plastic chambers. The plastic chambers were utilized in areas with high groundwater. Construction of this project was completed in April 1996. To complete the construction of the project, the town cash contribution alone equaled $70,385.87. With in-kind contributions by the town, the town’s total match was estimated to be approximately $85,000.
Prior to the construction of the infiltration structures, the Town distributed a Broad Marsh River Project brochure to homeowners in the immediate area. The brochure, written by the Buzzards Bay Project, described the purpose of the project, what the construction entailed, and what the general public could do to improve water quality. The materials in the brochure were also used to develop an informational sign and a display. The sign was placed onsite during construction. Once the construction was completed, the display, depicting the locations of completed Wareham’s stormwater remediation projects, was put together by the Town and the Buzzards Bay NEP. The display is currently in the Wareham Public Library and will eventually be placed in the Wareham Town Hall.
Following construction, the Buzzards Bay NEP monitored three infiltration systems starting in October 1996 and ending in June 1997. Parameters such as metals, (Zinc, Copper, Cadmium, Chromium, and Lead), Total Suspended Solids (TSS), Total Petroleum Hydrocarbons (TPH), and Volatile Organics (VOC) were monitored in the catch basins and the groundwater wells once during a rain event. Most of these contaminants that had elevated levels in the discharge were reduced greatly by the infiltration.
Fecal coliform bacteria, the pollutant of primary concern, was during five rain events (during the rain or shortly after). Samples were taken at the catch basins (when water was flowing in the basin), the groundwater wells, and the river. The Division of Marine Fisheries, in their efforts to assist the Buzzards Bay NEP, increased their fecal coliform monitoring of the river and also provided verbal observations of the discharges. Overall, the monitoring results from the catch basins and groundwater monitoring wells, indicate that infiltration structures are highly effective in removing fecal coliform bacteria, often exceeding 99.99% reductions.
Fecal coliform levels in the receiving waters were more difficult to interpret because many other non-point sources of pollution contribute to both background and stormwater related increases. Despite this noise, a statistical analysis of the data show that post construction fecal concentrations were significantly lower than preconstruction in the receiving waters. Whether the shellfish beds will be reopened, however, will depend upon additional monitoring and assessment by the Massachusetts Division of Marine Fisheries (DMF), the agency responsible for classifying the shellfish beds.
II. Introduction
In 1993, the Town of Wareham, in collaboration with the Buzzards Bay NEP, received through the Department of Environmental Protection – Office of Watershed Management (the Department) an Environmental Protection Agency funded 319 Nonpoint Source Pollution grant. The town requested the funding to reduce the impacts of stormwater pollution on Broad Marsh River. The Buzzards Bay NEP (BBP) prepared the 319 proposal on the towns’ behalf and provided planning and technical assistance to the town.
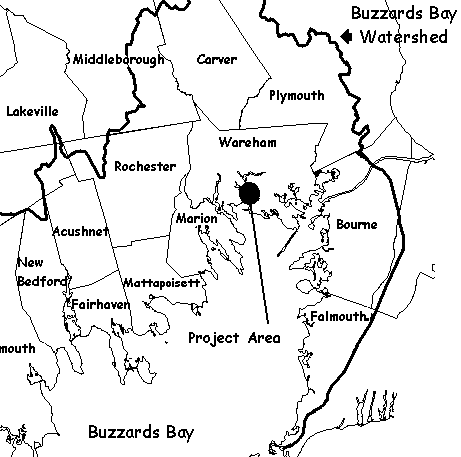
The Broad Marsh River Stormwater Project involved the remediation of 16 stormwater discharges (Location Map – Figure 1). Stormwater pollution (specifically fecal coliform bacteria) was contributing to the closure of shellfish beds in the river. Infiltration structures were selected as the best alternative to treat the first flush of stormwater runoff. Due to the complicated nature of this site, the designs for the infiltration structures went through several revisions. Construction began in November 1995 and was completed in April 1996.
As part of the 319 contract, the Department requires a final report on the Broad Marsh River Stormwater Remediation Project. This final report summarizes the project and describes the tasks leading up to and through the construction phase and the post-construction monitoring of this project.
III. Background and History
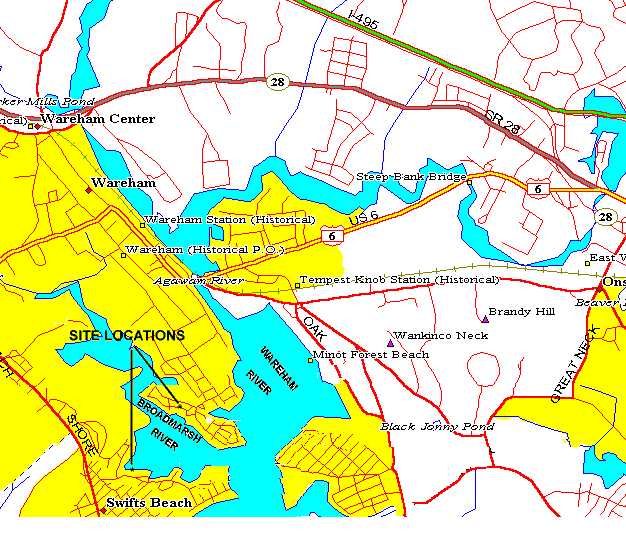
The Broad Marsh Stormwater Remediation Project began in 1990 when the town of Wareham requested funding through the Buzzards Bay NEP’s mini-grants program. The Town submitted a proposal to improve the water quality in the lower section of Broad Marsh River through the remediation of stormwater discharges. These discharges, located in the Pinehurst and Swifts Neck section of town (Discharge Map – Figure 2), showed elevated counts of fecal coliform bacteria during rain storms. The Town, in consultation with the Massachusetts Division of Marine Fisheries (DMF), believed these discharges had a significant impact on the closure of Broad Marsh River to shellfishing (DMF 1990 Sanitary Survey – Appendix A).
In addition, several public and private beaches are located along the river. Although none of the beaches have been closed to shellfishing, monitoring of the public beaches (from a public health standpoint) has been limited, and samples are taken infrequently and not always during worst case conditions, such as after a rainfall. The close proximity of the stormwater discharges to the public beaches also represents a potential threat to public health. For these reasons, the town was concerned about the public health risks associated with the stormwater runoff, and this was another factor prompting town action, and addressing stormwater problems at Pinehurst and Swifts Neck is expected to only improve water quality at the local beaches.
Due to limited finances, the Buzzards Bay NEP was unable to provide the funds for the Broad Marsh River Project. The BBP, however, felt the project had merit and wanted to help the town achieve the necessary funds to implement the project. In 1991, the BBP submitted joint proposals with both the towns of Wareham (Broad Marsh River) and Marion (Spragues Cove) for funding under the Massachusetts Department of Environmental Protection’s (DEP) 319 Nonpoint Source (NPS) program. DMF supported both towns and the BBP in their efforts to reduce pollution loadings into Buzzards Bay. In that year, only the Spragues Cove Project was funded by DEP.
Despite this lack of funding, the Buzzards Bay NEP and the town of Wareham continued to go forward with the Broad Marsh River Project. The Buzzards Bay NEP and the town requested planning and technical assistance from the Natural Resources Conservation Service (formerly the Soil Conservation Service). In 1992, the town and the Buzzards Bay NEP resubmitted this project with additional preliminary design work for 319 funding, requesting $88,450.00 to remediate the stormwater discharges. A match (both as cash and in-kind services) of $71,020.00 was committed by the town as their contribution. Finally in 1992, the town was awarded the grant by DEP and the contract signed with DEP in June 1993).
IV. “Best Management” Alternative
The Buzzards Bay NEP requested planning and technical assistance from the Natural Resources Conservation Service (NRCS) for the Broad Marsh River Project. NRCS put together an interdisciplinary team (including engineers, biologists, soil conservationists, a geologist and a soil scientist) to work with Buzzards Bay NEP and town representatives to identify alternatives and select best management practices (Planning Document – Appendix B). Preliminary soils investigations were conducted to determine soil texture and percolation rates.
 Several alternatives to reduce the coliform loads from the stormwater runoff were considered. Alternatives such as chlorination and UV dissectors were not considered feasible due to the high capital costs plus high post-construction expenses. Alternatives considered were surface detention/retention basins and subsurface infiltration structures. At the time of the BMP selection, extended detention basins were thought to provide good overall water quality treatment. Not much was known, however, about detention basin effectiveness in removing fecal coliform bacteria. Surface retention (infiltration) basins and trenches were considered highly effective treatment (60-100%) for the removal of bacteria (1). Both of these types of surface basins (detention/retention) are considered “end-of-pipe” solutions, requiring land at or near the pipe outfall, a problem for this site.
The Pinehurst and Swifts Neck sections of town are densely populated – open land areas are limited in number and in size. Since there were sixteen sites of stormwater discharge, the town would have had to purchase land (including houses) to install surface basins if this management solution was selected. The town would also have to restructure the existing drainage system to accommodate the use of surface basins. The costs associated with installing surface basins did not make this an economically feasible option for the town, sidelining factors such as maintenance and efficiency.
The selected alternative – subsurface (under-the-road) infiltration structures – were considered to be the most feasible option given costs, maintenance requirements and effectiveness. Since the road was owned by the town, purchasing land for implementation would not be required. This subsurface option, however, was not without problems. By placing the infiltration structures under existing roads, the town needed to contend with the underground utilities. Gas, sewer and water lines were under the road surface and the electrical lines were overhead.
The Pinehurst section especially, posed a major problem with utilities. The roads are very narrow (12 feet wide) and the utilities are laid out in a random pattern, crossing from one side of the road to another and over and under each other. In addition to the functioning utility lines, there were also several old, unused water lines. These lines were eventually capped at the request of the Wareham Water Department.
V. Site Investigation and Design
The preliminary soils investigation indicated that the soils in the area were Carver, coarse sand. The percolation rate in the test holes was very fast – less than two minutes to the inch. The investigation also indicated that groundwater could be a problem at some discharge sites. Subsequent data collection using test pits, Ground Penetrating Radar equipment, and monitoring wells confirmed that groundwater was close to the surface at some sites. Despite knowing the potential problems with the utilities and the groundwater, the town felt this was a worthwhile project and decided to go forward.
Once a consensus was reached on the selected alternative and the preliminary site investigation was completed, NRCS moved forward with the design. The objective of the design was to maximize the pollutant removal capabilities of the infiltration structures while minimizing the disruption to the road and utilities. As part of the Memorandum of Understanding with the Town, NRCS would provide the site investigations, survey work and designs needed to implement the project while the town would supply the materials and labor (or funding for labor) for construction.
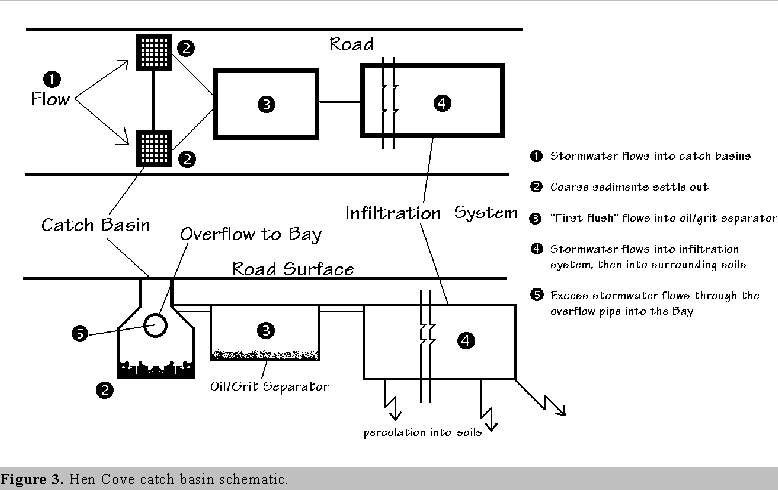
The original design concept utilized design criteria similar to the Hen Cove Stormwater Project in Bourne (Figure 3). The Hen Cove Project was funded by the Buzzards Bay NEP and designed by NRCS in 1990. The design methodology was adopted from the Maryland Department of Natural Resources’ Standards and Specifications for Stormwater Management Infiltration Practices, Feb. 1984 (2). The Maryland methodology uses the percolation rate of the soil to determine the volume needed in the infiltration structures to store the first flush of stormwater runoff. To take into account the potential reduction of soil infiltration in future years, NRCS based the design of the structures on a four minutes per inch infiltration rate. The rate was at least two times slower than the field rate of two minutes per inch. At the time of the Hen Cove design (1990), this reduction was believed to be adequate to maintain the integrity of the leaching system for the future. This methodology was used to estimate the number of infiltration structures and the subsequent cost of implementation for the 319 grant proposal.
Once the survey of the sites was completed and the design process well under way, some concerns were expressed by NRCS and the Buzzards Bay NEP about the long-term functioning of the infiltration structures. Monitoring studies of infiltration practices (basins, structures, trenches, etc.) indicated that these practices did not perform as designed and had a high rate of failure within the first five years of installation (3). Suspended solids from stormwater runoff would clog the infiltration structures and reduce the infiltration rate of the soil.
The storage volume of the original infiltration structures was calculated using half of the soil infiltration rate. Even though the design had built in a future reduction of soil infiltration, the concern was whether this reduction would be adequate. If the infiltration rate became less than four minutes per inch (due to clogging), the infiltration structures would not provide the necessary storage for stormwater. Inadequate storage volumes would result in smaller amounts of the design storm (less volume of runoff) being “treated” or controlled.
 Discussions with the Town and the Buzzards Bay NEP concerning the soil infiltration issues, led NRCS to forego the original design concept and begin the design process over. The design of the infiltration structures would be based on total storage of the first flush (100% capture of first half-inch of stormwater for storms of average intensity) volume and not on soil infiltration rates (which required less storage). The State of Rhode Island’s Stormwater Design and Installation Manual, Sept., 1993 (4) utilizes the total storage concept as the design criteria for infiltration practices. Even though the increased storage requirement would adversely impact the town’s budget for this project, the town opted for the redesign and, hopefully, a better long-term product.
In addition to the soil infiltration issue, designing the infiltration structures to fit between critical elevations proved to be difficult at five of the sites. The design involved utilizing existing catch basin discharge pipes as overflow pipes for the infiltration structures. The infiltration structures, therefore, needed to be placed below the elevation of the overflow pipe. A survey of the discharge pipes in the catch basins indicated that these pipes were lower in elevation than originally thought, placing the infiltration structures closer to groundwater. On these sites, a shallower infiltration system rather than the standard concrete structures would have to be used.
Once the second design was near completion, the concern was raised pertaining to underground utilities. The utilities were not part of the “design” package, and the locations of the utilities were to be 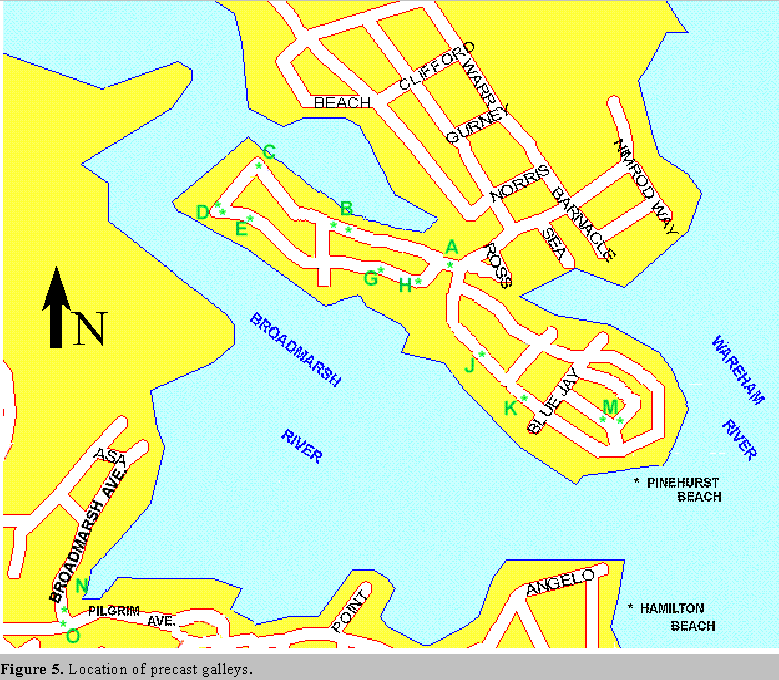 the responsibility of the contractor at the time of construction. With the expansion of this project to include more storage volume, the location of the utilities became a more critical component for installation. Manipulating the placement of the infiltration structures to work around the utilities would be less of an option during construction. The decision was to have “Dig Safe” and the Wareham Water Department locate the utilities and have NRCS survey the lines. The utilities would then be part of the design package.
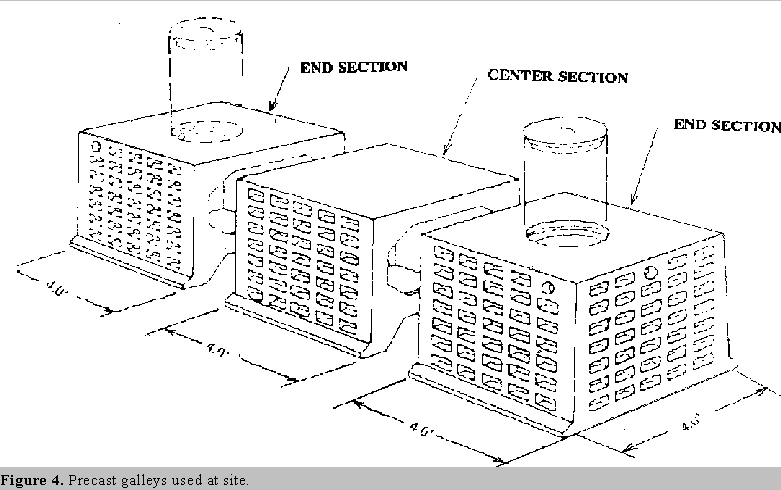
The final design (Design – Appendix C) was completed in April 1995. The design included two different types of infiltration structures, concrete leaching galleys and plastic infiltration chambers. The four by four galleys (Figure 4) were designed to be installed in areas with adequate separation 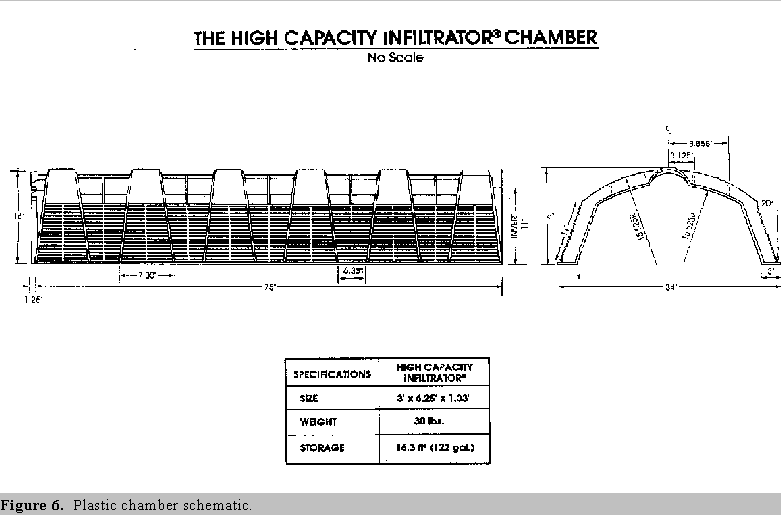 to groundwater, Sites A, B, C, D, E, G, H, J, K and N (Figure 5).
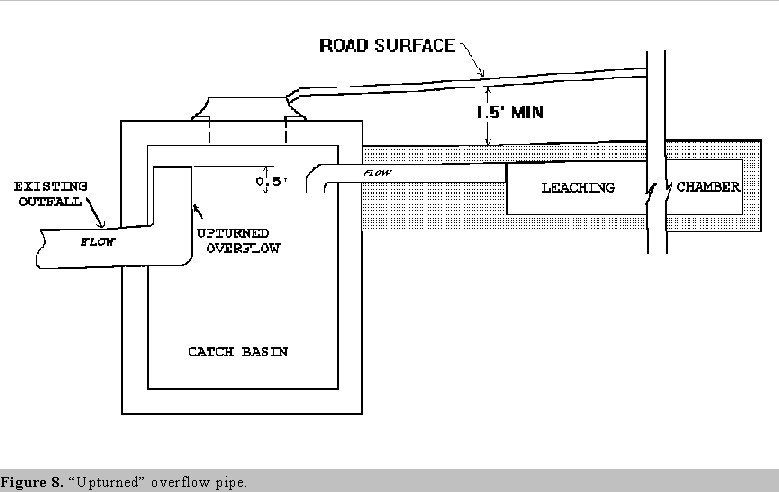
The plastic chambers (Figure 6) were for use in areas with shallow groundwater, Sites F, L, and P (Figure 7). Two of the sites, M and O, have a combination of the galleys and plastic chambers. To provide adequate storage for the first half inch of runoff and provide adequate groundwater separation, some of the overflow pipes at the existing catch basins needed to be turned upward with a 90-degree elbow (Figure 8). In addition, fifteen new catch basins were part of the design to accommodate utility lines. Based upon previous evaluations of infiltration basin BMPs, the approximate removal rate of stormwater bacteria is expected to be 80%.
Most of the construction would take place within the 100-year flood plain of the Broad Marsh River. The project, therefore, fell under the jurisdiction the Wetlands Protection Act and the Wareham Conservation Commission. Since this project was not creating new discharges and work was not proposed in a wetland, additional state and federal permits were not needed. The town applied to the Conservation Commission on September 22, 1995 and received the Order of Conditions on October 11th (Appendix D).
In conjunction with the permit process, the town also put the project out to bid. The town put together the bid package including the standards and specifications for construction materials and installation. The invitation to bid was advertised in the September 13, 1995 Central Register. A pre-bid conference was held on September 20th at the Town Hall in Wareham. The final date for receiving bids was September 28th. The Town received 4 bids ranging from $158,690.00 to 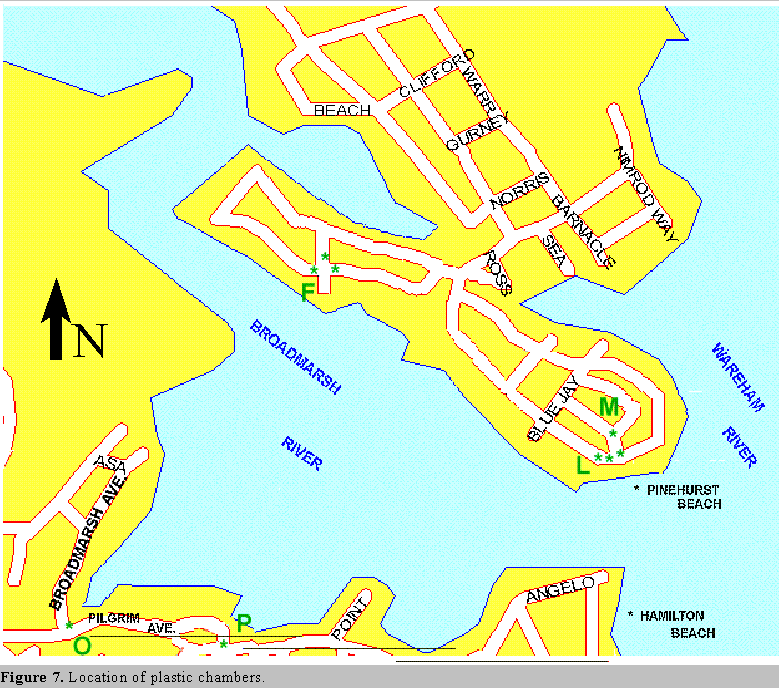 $242,695.00. The lowest bidder, C.C. Construction from Brewster, MA was awarded the contract on October 11th (Appendix E).
VI. BMP Implementation
The preconstruction conference was held on October 23, 1995. In attendance were:
Ken Moore C.C. Construction
Wes Haskell Wareham Water Department
Mike Rocci Colonial Gas Co.
Jim Shaw Wareham WPCF (Sewer)
Mark Gifford Wareham Municipal Maintenance
Charlie Rowly Wareham Engineer
Dan Barnett NRCS
Bernie Taber NRCS/BBP
 The major issue discussed at this meeting was the location of the utility lines. The Water Department and the Gas Co. requested that any old water and gas mains be plugged with concrete and any fill material placed around the new lines be well-compacted.
Mark Gifford offered the use of the “water tower” land, located in close proximity to the construction site, as an area to stockpile materials. Both Mark and Charlie Rowly were expected to be the onsite inspectors during construction.
Construction began in December 4th, 1995 at Site B. By January 2nd 1996, the Contractor installed infiltration structures in Sites A through M. Due to adverse weather conditions, construction had to be halted at this time. Construction began again on March 4th, 1996 at Site N and was completed by April 30th. The contractor encountered very few problems during implementation with only a few “field” adjustments to accommodate utility lines.
Once the construction was completed, the Town accepted responsibility for the inspection and long-term maintenance of the project. The Wareham Department of Municipal Maintenance has an annual contract with a private firm to clean out and inspect the catch basins in town. In addition to cleaning the catch basins at the project site, the access manholes will be opened and the components inspected. Repairs or replacement of the system components as a result of the inspection will be made by the town funded through their regular operating budget.
The Buzzards Bay NEP plans to assist the town with future inspections. As part of the ongoing water quality monitoring, the Buzzards Bay NEP routinely inspects the catch basins at Sites A, D, and M. If sediment accumulation is excessive, the Buzzards Bay NEP will report the findings to Municipal Maintenance and request cleaning. These inspections will indicate if the annual catch basin cleaning is adequate. If not adequate, the town can opt for more frequent catch basin cleaning or street sweeping or a combination of both. Cleanings every 1 to 2 years may be needed.
VII. Public Participation
The Buzzards Bay NEP developed an informational flyer (See Appendix F) for the local community. The flyer describes the types of pollution typically found in residential runoff, the impact of these pollutants (primarily fecal coliform bacteria) have on Broad Marsh River, and what they, as individuals, can do to clean up their River. Details (including a schematic view) pertaining to the infiltration systems and how they function is also provided in the flyer.
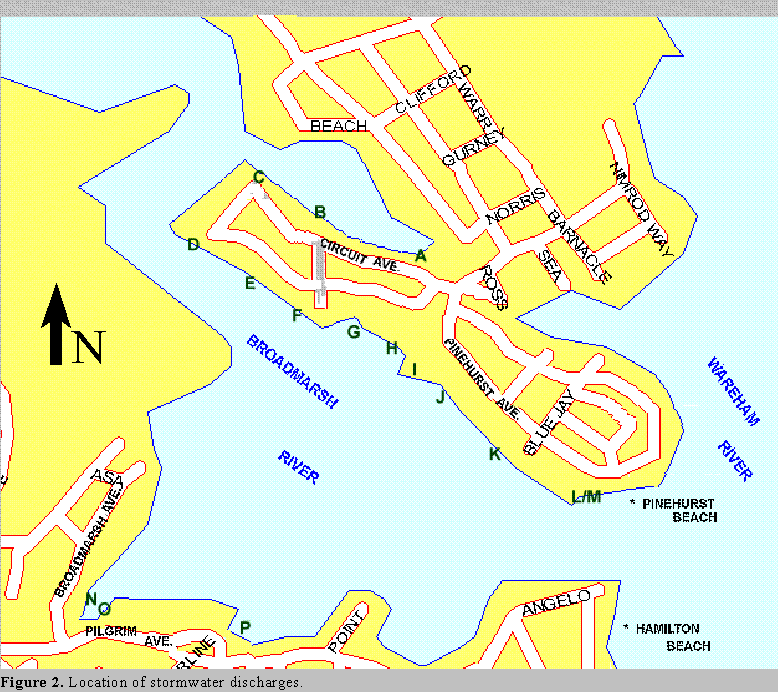
 The flyer was then given to the town of Wareham for their review and approval. Once the language in the flyer was finalized, the town had 350 copies printed. The flyers were distributed to the local residents prior to construction. The materials were also used to develop an informational sign that was placed onsite during construction. The Town decided to display the sign in the area with the most construction (Pinehurst Beach) and at the intersection with the largest traffic flow (the intersection of Pinehurst Drive and Circuit Avenue). In addition to the mobile sign and the flyers, the town has also put together a display of stormwater remediation projects in the Town of Wareham (Appendix F). The display (Fig. 9) is currently located at the Wareham Public Library and will eventually be placed in the Wareham Town Hall.
VIII. Monitoring Methods and Approach
As soon as construction was completed, the Division of Marine Fisheries began a visual inspection of the stormwater discharges (Figure 10). In August, DMF noticed that Sites N and O had stormwater flowing from the discharges during a rain event.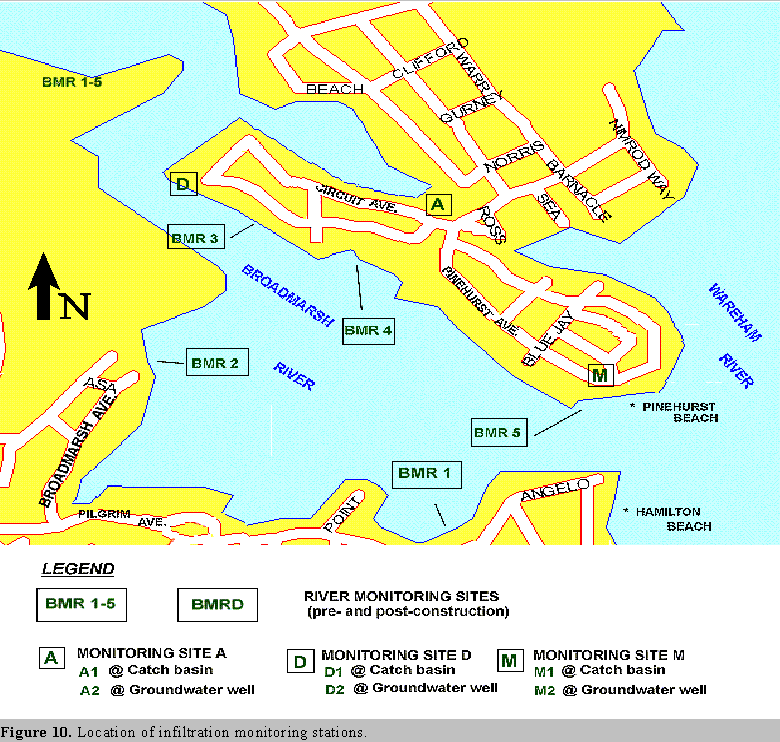 Water samples from these discharges indicated high fecal coliform loads (reported levels TNTC – too numerous to count) during a rain storm. At that time, the Wareham DPW was aware that an elbow at Site O catch basin was installed incorrectly and needed to be fixed. Because of the placement of the elbow, the first flush of stormwater was bypassing the infiltration structure and being discharged directly into the River. Mark Gifford (DPW), contacted CC Construction and requested the elbow on the discharge pipe be changed as indicated on the design.
During the next rain storm (September), observations of stormwater flow at Site N indicated that stormwater was bypassing the new catch basin. Instead stormwater was flowing into the lowest (in elevation) catch basin and then into the River without treatment. The Wareham DPW plans to resurface the area around the new catch basin, redirecting stormwater into the catch basin and through the infiltration structure.
Once the construction of all the infiltration structures were completed, the Town and the Buzzards Bay Project began to discuss the specifics of the monitoring wells. According to the DEP’s 319 contract (Scope of Services) with the Town, three of the “leaching catch basins” sites needed to be monitored following construction. Four locations (Sites A, D, L/M, and O) were identified as potential monitoring sites. The sites were selected based upon technology used (galleys or plastic chambers) and groundwater separation. The separation between the bottom of the infiltration structures and groundwater ranged from one foot to greater than four feet. These potential sites were located on a map and forwarded to the Department for their approval.
The primary focus of the monitoring program is fecal coliform bacteria. High levels of fecal coliform bacteria have resulted in shellfish bed closures in Broad Marsh River. The infiltration structures were installed to reduce stormwater-related bacteria discharging into the River. All the samples collected for this project were analyzed for fecal coliform bacteria. The secondary pollutant of concern, metals (zinc, copper, cadmium chromium, and lead), are sampled infrequently. The potential for groundwater pollution resulting from subsurface discharge of stormwater metals does exist. The metals are monitored at the catch basin inflow and at the groundwater well to determine the presence of metals in groundwater.
In August 1996, Mark Gifford, Wareham Department of Public Works, contracted the installation of the monitoring wells to a local well drilling company. The wells were installed at Sites A, D, and M. The selection of these three well sites was based upon placing the wells on town-owned land and minimizing the impact to underground and overhead utilities.
In consultation with Barnstable County Department of Health and the Environment (BCDHE), the Buzzards Bay NEP decided to use monitoring bailers to obtain the groundwater well samples. To prevent contamination of the samples, one bailer is dedicated for each groundwater monitoring well. The bailers and the training for collecting samples were provided by BCDHE.
The bailers were first used on October 8th to prepare the wells for monitoring. Each well was bailed a minimum of twelve times to remove sediment and standing water. Initially, the fine sediments clogged the check ball of the bailer, resulting in frequent cleanings of the bailer. As the groundwater became cleaner (less sediment), clogging became less frequent and the bailers worked more efficiently. After the wells were cleaned, they were left overnight and then cleaned again. Following this cleaning, groundwater samples were taken to determine background levels of fecal coliform bacteria.
Preparation for monitoring begins the day before an anticipated rain with the removal of stagnant groundwater and sediment from the wells. Using a Soil Test water level indicator, the water levels in the wells are read and the water volumes calculated. The wells are then bailed at a minimum of three times the calculated well volume.
Monitoring of the infiltration structures during a rain begins with the sampling of stormwater at the catch basins. The catch basin grate is removed and the pretreatment sample collected (Sites A1, D1, and M1 – Figure 10). Following the catch basin samples, water samples are taken from the river (BMR1-5 and BMRD). The post-treatment samples are the final samples and are collected from the monitoring wells (A2, D2, and M2) using the bailers. Salinity and temperature are recorded for the river samples and the well samples.
If the monitoring event includes metals, additional sampling bottles (100-250 ml) are obtained from the testing laboratory. After the fecal coliform containers are filled and placed in the cooler, additional stormwater is collected at the catch basins and the wells for metals. These samples are filtered in the field and then placed in the cooler. All the samples (fecal coliform and/or metals) are delivered to BCDHE for analysis. One to three days (depending on scheduling) after monitoring the stormwater, the groundwater wells and river sites are retested for the same water quality parameters (Appendix G).
IX. Evaluation
Three sets of data can be used to evaluate the effectiveness of the stormwater remediation project. The first and most direct data was the monitoring of contaminant concentrations in the stormwater entering the stormwater system, and comparing that to the discharge in the groundwater as measured by wells adjoining the leaching basin. The Buzzards Bay NEP monitored three leaching basins in this way.
The other two data sets of interest — the Buzzards Bay NEPs’ monitoring of six sites in the river, and DMF’s shellfish bed closure statistics based on two river monitoring stations is a less direct evaluation of the efficacy of the BMPs installed, but one of more interest to managers and the public. Because of the inherent “noisiness” of river data, and because these stormwater sources represent only an unknown portion of all fecal sources, these data were expected to be more difficult to interpret. A summary and interpretation of each data set are shown below.
Well-Infiltration Basin Comparison
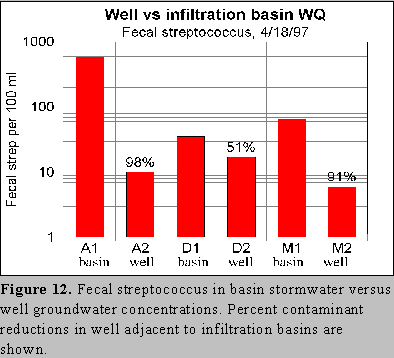
The Buzzards Bay NEP monitored three leaching basins and adjoining wells. These data are consistent with similar studies, namely that infiltration is a highly effective mechanism for eliminating fecal coliform discharges. As shown in Figure 11, even when fecal coliform levels reach 2000 fecal coliform per 100 ml in November of 1996, where there was 6.42″ of rain over four days, 100% of the fecal coliforms are removed. In fact, only on one date was any fecal coliform ever observed in the well samples. In both cases the concentrations were only 1 per 100 ml. On April 18, 1997, fecal streptococci were monitored in the three wells and in stormwater in the infiltration basins. While infiltration is not as effective in removing fecal streptococci (Figure 12), probably because of the bacteria’s smaller size, the percent reduction in the three basins nonetheless ranged from 51% to 98%.
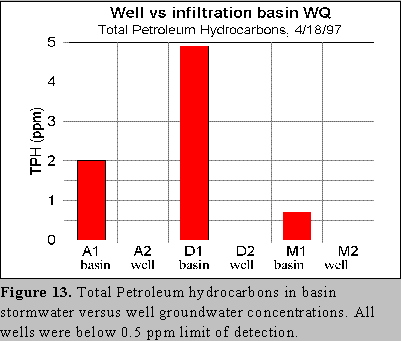
Total Petroleum Hydrocarbons (TPH) were also measured on that date, and the wells were all below the 0.5 ppm detection limit for the analysis (Figure 13).


The results from metals were less conclusive. For example, Cadmium, chromium, and lead values entering the infiltration basins were often near the 0.5 ppm limit of detection making interpretation of removal effectiveness impossible (not shown).
For certain metals, like zinc, that had somewhat elevated concentrations, reductions ranged from 60% to 83% (Fig. 14).
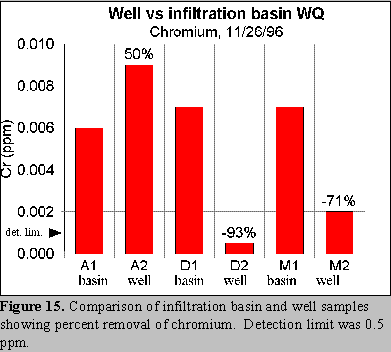
For other metals, even when elevated, removal results were not always consistent. For example, on 11/26/96, at the catch basins for sites D and M, chromium concentrations were 93% and 71% lower in the wells than in the catch basins, however chromium in well A2 was actually 50% higher than corresponding infiltration basin A1 (Figure 15).
Similarly, copper showed a decline in only one basin (Figure 16).
The lack of change in some metals like copper and lead may reflect the fact that overall metal concentrations were very low at this site, close to the limits of detection (or in the case of lead, at the limits of detection) for the analysis used. The one site where copper showed a decline was at well-basin test site D, which had a copper concentration about double the concentrations observed at the other two sites. Thus, it is possible that these infiltration basins would be ranked more effective in a more urbanized area where metal concentrations are expected to be higher.
Basin D had the highest concentration of copper, zinc, and TPH that may reflect its somewhat denser levels of development in that portion of the subwatershed.
Overall, the findings of this monitoring program met expectations that infiltration basins are effective in reducing fecal coliforms and hydrocarbons, but may be less effective in removing metals that may exist in more soluble forms.
River Monitoring Stations
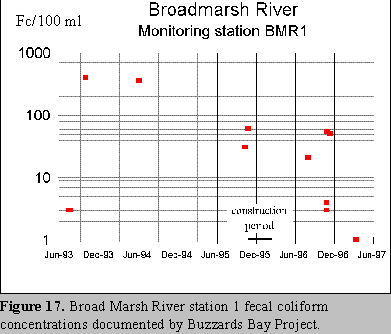
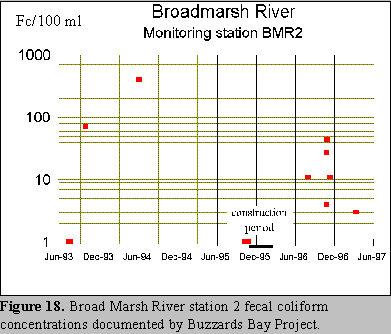
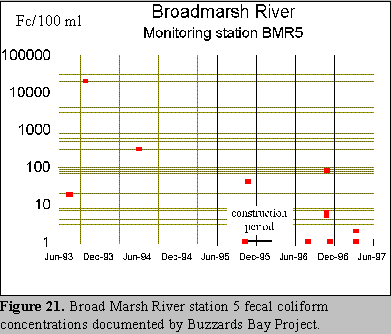
The Buzzards Bay NEP monitored concentrations of fecal coliforms in Broad Marsh River near the stormwater discharges before and after implementation of the stormwater remediation designs (Figs 18-20). Interpreting this data is more complex because of the many factors affecting fecal coliform levels at any particular site on a given day. Especially important is the rainfall amounts 48 hours before sampling.
For example, in June 1994, a 2.6″ rainfall coincided with very high fecal coliforms at most river stations. Fortunately a similar post construction sampling on October 9, 1996 coincided with a 3.0″ heavy rainfall. While water temperatures on the October 1996 sampling were only 15 C, cooler than the June 1994 sampling of 25 C, the November 1996 temperatures are warm enough for survival of fecal coliforms from most sources, and the water temperatures are not as extreme as winter when there is a pronounced die-off of fecal bacteria. The June 1994 sampling tended to have the highest preconstruction levels of fecal coliforms, and the November 1996 samples tended to have the highest post construction fecal coliform concentrations for the monitoring stations.
The preconstruction June 1994 sampling clearly had higher fecal coliforms at stations 1, 2, and especially 5 than on post construction November 1996 (Figs. 17, 18, and 21). Station 3 showed comparable levels on both dates (Fig. 19), and only station 4 (Fig. 20) showed a higher fecal coliform concentration on the post construction heavy rain date.
Similarly, the October 10, 1993 samples with 0.23″ of rain are best compared with post construction dates of August 13, 1996 with 0.85″ of rain and March 26, 1997 sampling with 0.91″ of rain. The October 1993 sampling generally had the second highest pre-construction fecal coliform levels.
For stations 1, 2, 3, and especially station 5, the October 1993 fecal coliform levels were consistently higher in fecal coliforms than the comparable August 1996 and March 1997 dates. Only at Station 4 was this trend not observed.
The fact that station 4 shows high post construction levels compared to high preconstruction concentrations on both rain dates suggests that other fecal sources are confounding factors at this site or that the remediated discharge was a small fecal source compared to others present.
Perhaps equally important is the fact that these remediated stormwater discharges represent only a portion (and an unknown one) of the total fecal coliform loadings to the River. Moreover the stormwater treatment system was designed only to handle the first flush of stormwater. Despite these limitations, fecal coliform concentrations do appear somewhat lower after construction than prior.
DMF Data
Data from the Massachusetts Division of Marine Fisheries’ (DMF) shellfish monitoring program parallels the fecal monitoring program by the Buzzards Bay NEP in showing that fecal coliform levels in Broad Marsh River have shown a slight but measurable decline in fecal coliform concentrations. DMF has monitored two stations in Broad Marsh River. While the entire embayment has been permanently closed since 1988, DMF is expected to review its recent data and data from the Buzzards Bay NEP to determine whether a change in closure classification is warranted.
DMF monitors two stations: an upper embayment Station 6-Pigs Point at Sea Breeze Lane, and a mid embayment Station 7- End of Broad Marsh Avenue (Data provided by DMF to the Buzzards Bay Project much thanks to Greg Sawyer. Data from these stations are shown on the following pages. In general DMF collects rain date water samples from storm drains the day of rainfall, but not necessarily at first flush. Often water samples collected in the river are generally at worse case conditions, within 1 to 3 days of a rainfall and during outgoing tides. However, many samples are also collected during dry periods.
Because all dates are included in the figures below we have used the following criteria for distinguishing “wet” and dry condition sampling. Wet condition sampling is identified on the graphs as any sampling date with 0.15″ of rain the day of sampling, 0.40″ within 48 hr of sampling, and 2.00 inches within 96 hr of sampling. In the latter case we have noted that rainfalls exceeding 2″ can raise fecal coliform levels in an estuary for many days. Similarly the 48 hour total was a volume that we believe can influence water quality conditions for two days. Finally the 24 hr total is approximately the volume of water necessary to generate stormwater discharges for light rain condition storms. While these criteria are somewhat arbitrary, they help explain some of the variability in fecal coliform concentrations shown in the graphs below.

As shown, Station 7, which was monitored since 1994 has shown a slight but statistically significant 
decline in fecal coliforms in the post construction period (Figs. 22 and 23). The Students t-test results in Figure 13 were for a 1-tailed test with p<0.10 on untransformed data. The test was also performed on log-transformed data assuming that the data is lognormally distributed, and this test was also significant at the p<0.10 level (not shown). As is apparent from Fig. 22, background levels remain unchanged but clearly fewer high levels have occurred since construction of the stormwater treatment system.
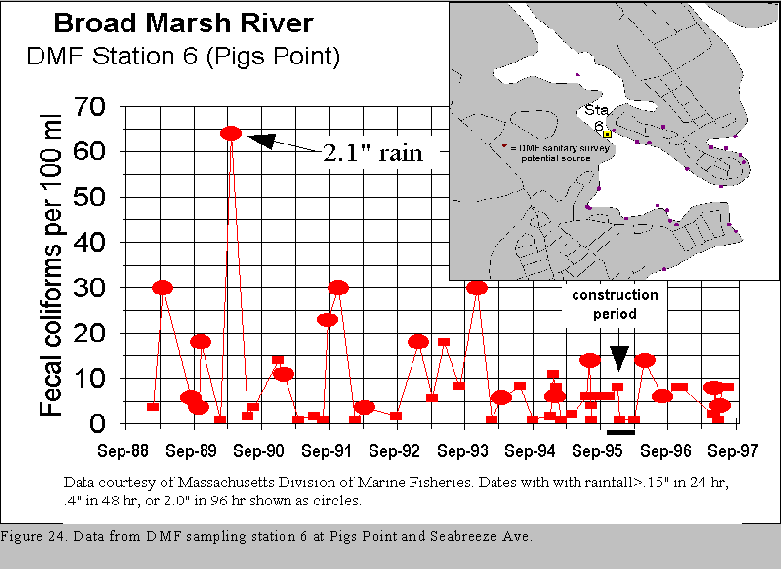
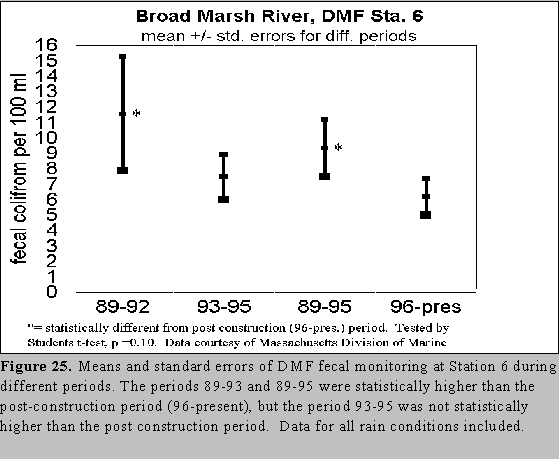 The results from the upper embayment Station 6 (upstream of the stormwater treatment systems) are less clear. Background levels are somewhat lower at this site than Station 7, and during the period Station 7 was monitored (Fig. 24). Even the highs at Station 6 were considerably lower than Station 7 during the period Station 7 was monitored (1994 onward). Prior to 1994, fecal coliform concentrations appeared higher at Station 6 (Figure 25). A Students t-test found the 88-95 statistically higher than the post construction period (96 to present). The period immediately prior to construction (93-95) showed somewhat higher fecal than post construction, but not significantly so. Overall it appears that upstream sources to Station 6 may have also changed and that the stormwater remediation project has had only modest impact on water quality at Station 6 which now has fecal coliform levels close to background and only once exceeded the shellfish bed standard of 14 fecal coliform per 100 ml since the stormwater treatment system was constructed.
X. Conclusions
The Broad Marsh River Stormwater Remediation Project has been installed to demonstrate the effectiveness of infiltration systems in removing pollutants from stormwater runoff. Two areas within the Broad Marsh River watershed were selected for remediation – Pinehurst Beach and Swifts Beach. The conditions for these sites were less than ideal with a high ratio of impervious surface (roads, drives, and roofs), narrow roads, a multitude of underground utilities, and high groundwater. The soils, however, were excellent for infiltration – Carver coarse sands, with a percolation rate of 2 minutes per inch and less. These site conditions are fairly typical of older formerly seasonal residential areas found along the coastline of Wareham and the Cape.
At many of the existing catch basins, the presence of the underground utilities and the amount of infiltration structures needed to treat the full half-inch precipitation event, required the division of roadway surfaces into several catch basins and infiltration systems. Two types of infiltration systems were installed, concrete galleys and plastic chambers. Two of the galley systems and one plastic chamber system were set up for monitoring. Fecal coliform bacteria, due to shellfish bed closure in the River, is the primary pollutant of concern. From the limited amount of post-construction monitoring (five events for fecal coliform, one event for all other parameters), the sampling data indicates that the infiltration systems very effectively remove fecal coliform (>99.99% removal) and fecal streptococcus bacteria (generally > 90%) from stormwater runoff.
The effectiveness of the infiltration systems to remove secondary pollutants, was demonstrated, despite the fact that these contaminants were in low concentrations as compared to urban areas. In particular, the basins were highly effective at removing petroleum hydrocarbons and zinc, with all Petroleum and VOCs removed to below detection limits. Most of the other parameters (chromium, copper, etc.), because their concentrations were low to begin with and often near detection limits, did not show as great of a percent removal as expected. Still, removal of these pollutants often exceeded 50%.
With regard to the long term goal for the estuary, reopening shellfish beds, the long-term effectiveness of the infiltration structures and impact they will have on water quality of Broad Marsh River remains to be seen. Although the water quality data for the estuary is “noisy” because of other background sources and nonpoint sources, a statistical analysis of fecal coliform levels in the receiving waters shows that fecal bacteria concentrations were on average lower once the BMPs were installed.
The Buzzards Bay NEP and the Division of Marine Fisheries will continue to monitor fecal coliform levels of the infiltration systems and the river. Ultimately the decision to reopen shellfish beds will be made by the Division of Marine Fisheries. That agency is currently reviewing existing data and new data collected in 1998 to determine if the shellfish beds should be reopened.
The Town of Wareham is also committed to continue reducing stormwater discharges into Broad Marsh River and in other areas of town. A design to remediate the discharges from the Wareham Municipal Complex, which discharges into the upper part of Broad Marsh River was recently completed by the Town. The town recently received funding through Massachusetts Coastal Zone Management’s Coastal Pollution remediation program to implement this new work. It is hoped that this next phase will further reduce fecal coliform concentrations in the Broad Marsh River estuary to clearly warrant shellfish bed reclassification.
XI. References
1. Controlling Urban Runoff: A Practical Manual for Planning and Designing Urban BMPs (p. 2.12), July 1987; Metropolitan Washington Council of Governments.
2. Standards and Specifications for Stormwater Management Infiltration Practices, Feb. 1984; Maryland Department of Natural Resources.
3. A Current Assessment of Urban Best Management Practices (p. 39-54), March 1992; Metropolitan Washington Council of Governments.
4. Stormwater Design and Installation Manual (p. 27-32), Sept., 1993; State of Rhode Island.