Shellfish Catch Trends in Buzzards Bay and all of Massachusetts: Summary Figures
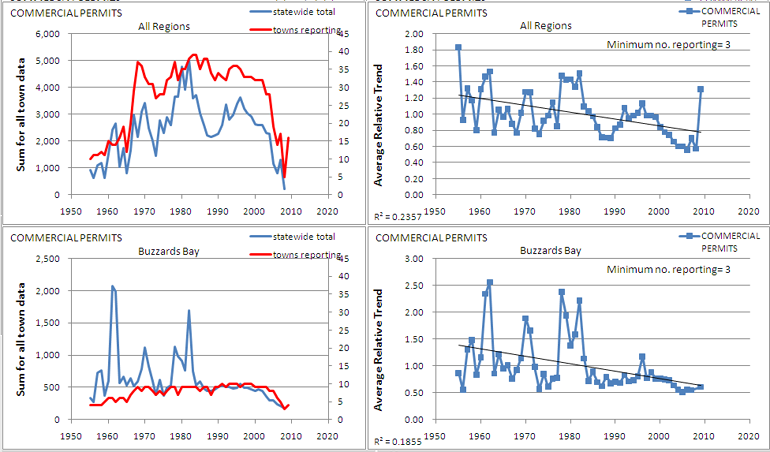
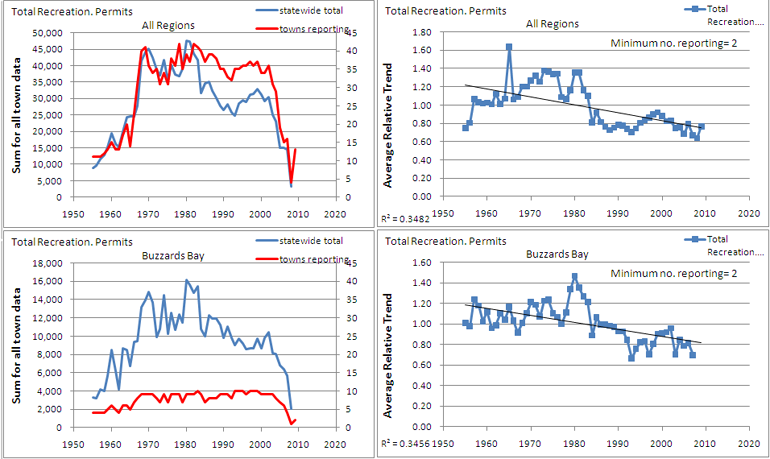
In general, shellfish permit and catch statistics in Buzzards Bay have been consistent with overall trends in Massachusetts during the past 50 years. In both Buzzards Bay and the rest of the state, the relative number of commercial shellfish permits issued has decreased somewhat. There appears to be a slight drop off in the early to 2000s, possibly in part due to the oil spill in Buzzards Bay and red tide closures elsewhere around the state. In contrast, there has been a more distinct decline in the number of recreational permits issued after 1980.
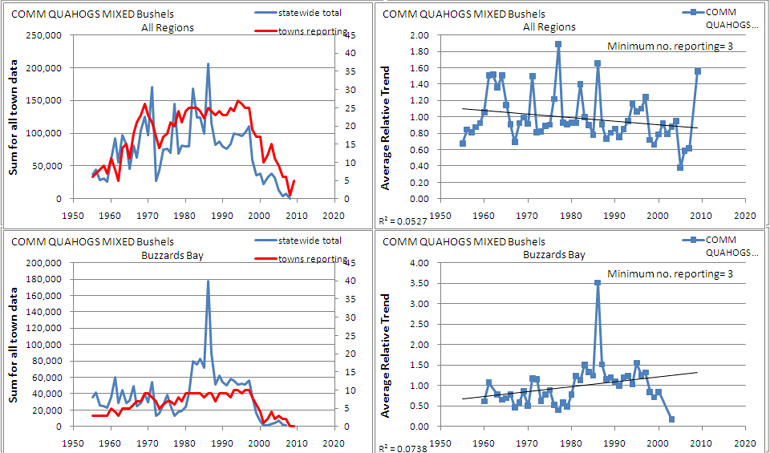
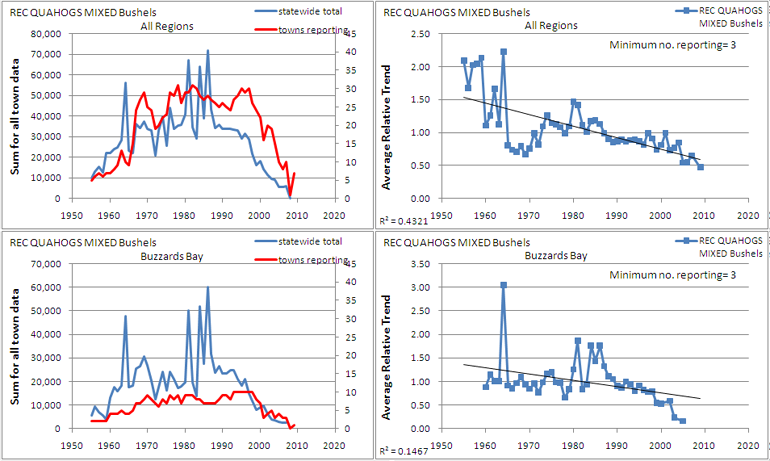
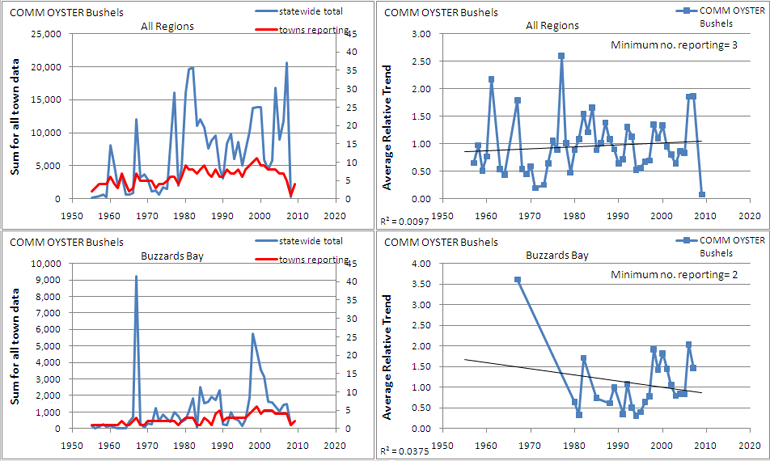
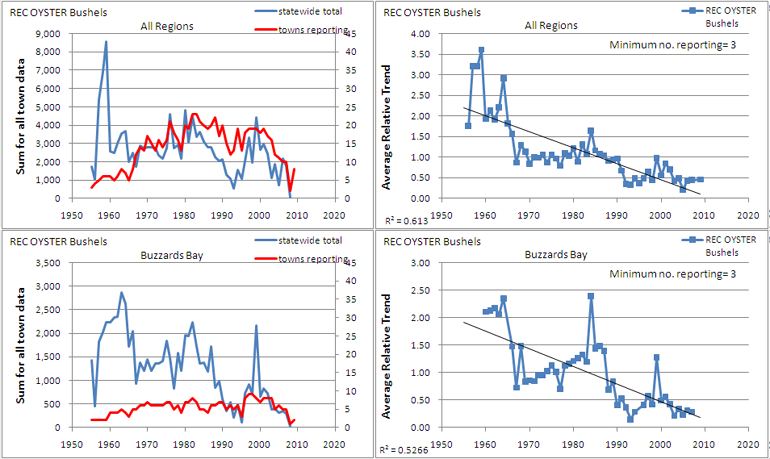
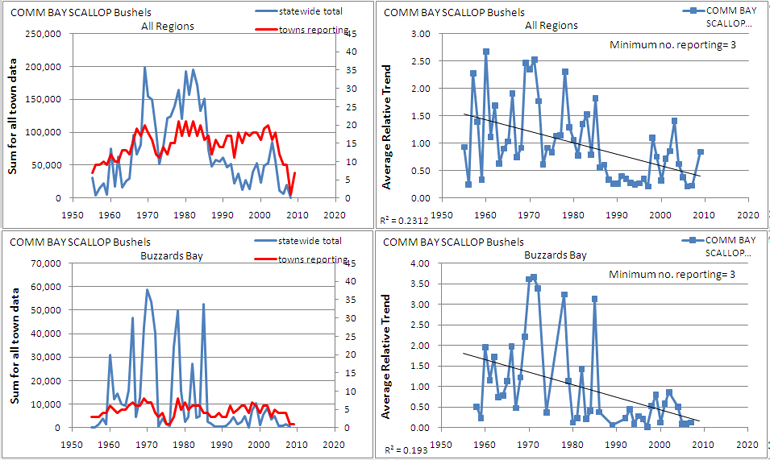
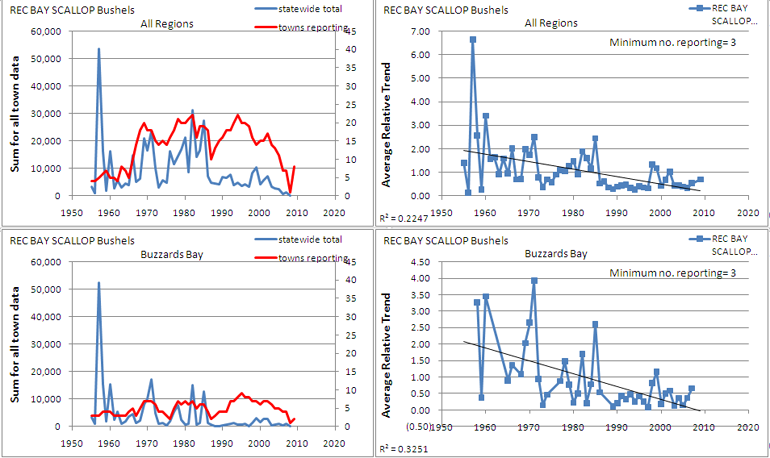
With respect to catch, the commercial catch of quahogs (the highest volume species), has been variable, with a slight decrease in abundance. Commercial catch in Buzzards Bay actually went up in the late 1980s because large areas around New Bedford were reopened to shellfishing after decades of closure. Commercial catch of oysters statewide has also been variable but without a distinct trend. In contrast to these data, commercial catch of bays scallops, and recreational catch of all three species have declined, sometimes dramatically, both in Buzzards Bay and statewide.
In the graphs below, relative trends among all municipalities were normalized and averaged. The methodology used to analyze the data and create the graphs are on our Shellfish Catch Trends Analysis page. On each graph, a trend line has been added for the entire period of data, but for some data sets, actual trends of increase or decrease may be pronounced only over a portion of the data period.
To make your own graphs for other species, or to create a graph for just one town, open the spreadsheet at the bottom of that page.
Shellfish Landings Relative Trends Analysis Tool Spreadsheet last update: Jan 24, 2011.