Town of Marion Flood Zone Information
Related pages: Fema Maps BB
To implement a number of recommendations in the Buzzards Bay CCMP requires a good understanding of the location of the 100-year floodplain (Federal Emergency Management Agency, or FEMA FIRM maps), barrier beaches, and areas of high erosion. This page provides maps and key links to this information for the Town of Marion, including maps prepared by the Buzzards Bay NEP.
A property owner’s primary source of flood plain information is the FEMA National Flood Insurance Rate Maps (FIRM) to definitively identify flood plain boundaries for insurance purposes (unless parcel specific data is available). The maps and links below provide good estimates of those boundaries. More information about the FIRMs can be found on the FEMA fact sheets page for the program. Draft FIRMS in paper form were prepared for Plymouth County, including the Town of Marion, and these were expected to be finalized in 2010, but because of problems in the draft maps, the release of updated draft maps was delayed until late in 2011. Read this 1/24/2011 FEMA letter to the Town of Marion for more information.
Because of the approximate nature of even the original FIRMs, property owners sometimes conduct their own studies to identify flood plain elevations. (Visit FEMA page: How To Request a Flood Hazard Determination Review from FEMA).
In the sections below, we provide some useful tools to help interested parties identify flood plains, including the most recent updated information for Bristol County.
Updated FEMA FIRM maps for Buzzards Bay Communities
Interactive FIRM Maps
FEMA has provided a FIRM MAP display page. At this page you can print a personalized “FIRMETTE” map for your home. Fema also offers this online mapping information platform.
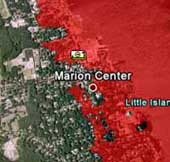
Marion 15-ft Elevation Zone
This interactive Google Earth map has data for all areas of Marion, except a tile in the northwest portion of the town just north of Rt. 195 (it appears as a a portion of square block missing from the coverage). This map is for planning purposes only. For insurance determinations, consult only with original fema documents.
Do you have Google Earth installed on your computer (a free program)? If not go to the Google Earth website to download it.

Marion 15 ft elevation zone
(a 260 kb kmz file, requires Google Earth).
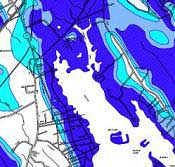
ACOE SLOSH map of Marion
In 2009, FEMA updated its FIRM maps for Bristol County. Draft hard copy maps for Barnstable and Plymouth County have been released to municipalities, but have not been finalized, so digital copies are not yet available. In 2010, Plymouth and Barnstable County final maps and digital shapefiles should become available. To check the status of this effort, go to this FEMA Multi-Year Flood Hazard Identification Plan (MHIP) site and this Flood Mapping Information page. To download maps or digital GIS data, visit the FEMA Map Service Center (choose “flood maps” for pdf maps or “DFIRM databases” for GIS files).
Explanation of Marion 15 foot Elevation Map
A LIDAR aerial mapping flight(Light Detection and Ranging) was conducted in November and December of 2007 by Sanborn Mapping Company under a contract with the firm Camp Dresser and McKee for FEMA to help evaluate the new FIRMs. The Buzzards Bay NEP obtained this data to prepare a Google Earth-readable kmz file that shows portions of Marion that are equal to or below a 15-foot elevation. This elevation coincides largely with the FEMA FIRM flood elevation for the town (a small area of the town has a 14-foot elevation flood zone). Based on LIDAR data, in 2009 Camp Dresser and McKee developed GIS Triangulated irregular network (TIN) digital elevation models for FEMA, as described in the report, Flood Mapping Activities for Plymouth and Bristol Counties, Massachusetts (29 MB pdf). Task Order 18 Activity 1–Topographic Data Development / Acquisition Summary Report. Contract No. EME-2003-CO-0340 Task Order T018. Prepared for: FEMA Region I, February 2008. CDM developed a bare earth TIN Digital Elevation Model based on this data, which was used as the basis for this coverage. In an evaluation of the study area, CDM determined that the root-mean square average difference in elevation for 48 surveyed points as compared to the LIDAR TIN data was 0.52 feet, and this met the FEMA minimum accuracy requirement of 1.2 feet. Based on this evaluation, CDM concluded, based on this analysis, this LIDAR data is acceptable for use in H&H analyses and flood zone mapping.”
Click the 15-foot elevation map link in the sidebar on the right to open a Google Earth data set. Here is an 8 1/2 x 11 inch version of the map as a (1 MB) 15 foot zone pdf file. Users of GIS software can also use this ArcView shapefile.
WARNING: This data set, which became available in 2009, may or may not be consistent for any given area on the draft FEMA FIRMS available at the Marion Town House. Consult with the Marion Conservation Commission and Marion Building Inspector on the use of this data.
Hurricane Surge Inundation Maps
The US Army Corps of Engineers, as part of its Hurricane Evacuation Studies for New England, produced Hurricane Surge Inundation Maps for New England, also known as “SLOSH” maps. Hurricane surge elevations were determined by the National Hurricane Center using the SLOSH model (Sea, Lake and Overland Surge from Hurricanes), and assume peak hurricane surge arrives at either mean tide or mean high tide, as indicated at the bottom of the maps. The hurricane surge inundation areas shown on the maps depict the inundation that can be expected to result from a worst-case combination of hurricane landfall location, forward speed, and direction for each hurricane category. Ground elevation data was obtained from the USGS National Elevation Data Set.
Click on the map to the right to view the Marion SLOSH map as a pdf file.
