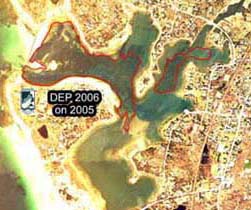
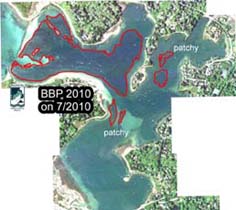
Historical Eelgrass Abundance: West Falmouth Harbor
Note: The data and maps on this page will be included in a forthcoming report summarizing changes in eelgrass distribution in Buzzards Bay. The information is posted here to facilitate review of the information, but the data should be considered to be in draft form and subject to change.
Summary
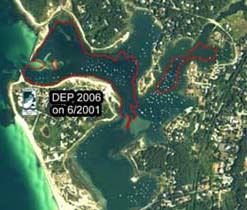
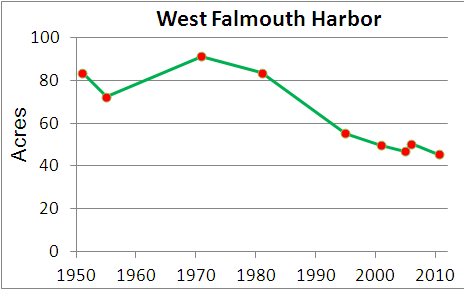
Eelgrass in West Falmouth Harbor declined from the early 1990s through 2000s due to increased nitrogen loading from septic systems in the watershed and a groundwater plume from the Town of Falmouth wastewater . The prognosis for West Falmouth is good however, because the town’s wastewater facility was upgraded in 2003 because of the imposition of stringent groundwater discharge limits. Concentration of nitrogen in the plume has been declining, and water quality in Snug Harbor has been improving as a result. Eelgrass beds have not shown any appreciable recovery yet, and mooring impacts (both chain scour and sediment resuspension) may be contributing to some of the persistent loss of eelgrass in the inner harbor.
Mooring Impacts
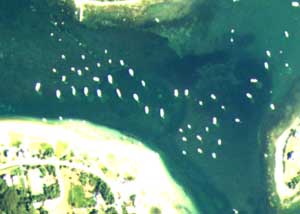
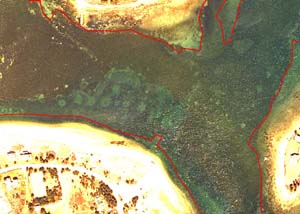
Moorings in the outer harbor have well defined mooring chain scour. Scour impacts in the inner harbor are harder to discern because of lesser contrast with muddier sediments. More importantly, the finer sediments in the inner harbor are more likely to be suspended because of chains bouncing up and down off the bottom from wave action. Sediment resuspension in the inner harbor, like eutrophication, may be diminishing the maximum depth of growth of eelgrass in the upper harbor.
Mooring chain scour scars in the outer West Falmouth harbor area in June 2001 (left) and in March 2005 (right, image contrast and brightness enhanced). Click on each image to enlarge.
Previous Summaries
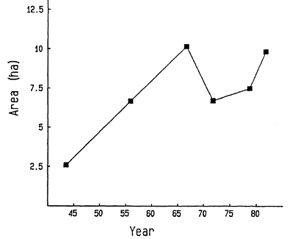
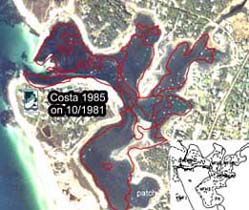
Figure from Costa (1988a+b). In this report, each delineated eelgrass bed polygon was assigned a percentage cover, so eelgrass bed acreages were calculated as the sum of acres x % cover to calculate an equivalent continuous eelgrass cover. This area is often considerably smaller than total habitat cover where there are extensive sparse or patchy eelgrass beds as is the case in West Falmouth Harbor and the chart above. [1 hectare = 2.5 acres]
Costa (1988) wrote,
“West Falmouth Harbor is a protected embayment with freshwater stream input primarily from [Mashapaquit Creek]. The watershed surrounding this bay is developed and there is evidence of water quality declines such as algal blooms and shellfish bed closures. This area was also impacted by a small oil spill in November 1970 (Sanders et al., 1980). No early documentation of eelgrass abundance was discovered. Eelgrass was abundant outside West Falmouth Harbor and just within the bay in 1943 …. Eelgrass expanded considerably during the 1950s and 1960s, but a November 1971 photograph shows that some beds had disappeared or had less cover than in 1966, particularly in the deeper parts of the bay, such as at the channel by the mouth of the bay. Like Wild Harbor, this decline could have been related to the oil spill because most other parts of Buzzards Bay do not a decline at this time, suggesting local conditions were the cause.” In addition, “Accumulated drift material and Ruppia in West Falmouth Harbor make interpretation of aerial photographs difficult, especially in upper estuarine areas like Harbor Head. To adjust for algal cover, eelgrass cover was estimated as 50% of vegetated habitat area.”
Howes et al. (2006) wrote,
“Eelgrass beds are highly sensitive to nutrient overloading. Eelgrass beds within West Falmouth Harbor have historically filled most of the sub-tidal area. Recent concern over the Harbor’s health stems from perceptions that eelgrass beds and the fish and shellfish communities they support are declining within the inner portions of this system. The presence of eelgrass is particularly important to the use of West Falmouth Harbor as bay scallop habitat.” They also noted “the [wastewater facility] plume first impinged on the Harbor in the 1992-1994 time frame, with the loading increasing until ~2002, due to loading at the WWTF.” They go on to note “The upper reaches of West Falmouth Harbor are presently showing poor water quality and ‘Eutrophic’ conditions. Eelgrass beds have been lost from these regions and oxygen depletion of bottom waters periodically occurs.
Unfortunately, almost all of the estuarine reach within West Falmouth Harbor is near or beyond its ability to assimilate additional nutrients without impacting ecological health. Nitrogen levels are elevated throughout the system and eelgrass beds have been lost throughout the inner basins and into the outer basins with the only remaining beds near the mouth of the harbor.
They go on to provide this detailed analysis [note they incorrectly note that the eelgrass cover in the late 1970s and early 80s was 1/3 of present cover, but the acreages in the Costa reports were based on bed acres adjusted for percent cover, and the total habitat cover in the 1980s was considerably greater than today.]
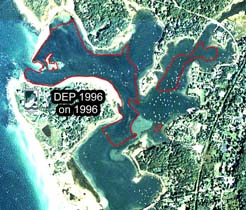
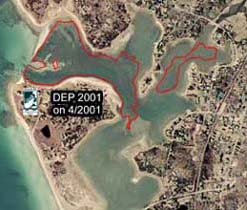
“Eelgrass surveys (1995, 2001) and analysis of historical data (1951) was conducted for the West Falmouth Harbor system by the DEP Eelgrass Mapping Program as part of the MEP Technical Team. These data were supported by other surveys in 1979 (J. Costa, Buzzards Bay Project) and 1999 (Howes et al. 2000). The historical analysis was based upon available high-resolution aerial photos from 1951, from which the eelgrass distribution prior to any substantial development of the watershed was determined. The 1951 data were only anecdotally validated, while the 1979, 1995, 1996-97 and 2001 maps were field validated. The 1979 mapping when nitrogen loading to the Harbor was ~1/3 of present day was consistent with the 1951 photo interpretation. The primary use of the data is to indicate (a) if eelgrass once or currently colonizes a basin and (b) if large-scale system-wide shifts have occurred. Integration of these data sets provides a view of temporal trends in eelgrass distribution from 1951 to 1979 to 1995 to 1999 to 2001 (Figure VII-9 toVII-12). The 1995 to 2001 surveys were completed during the time in which watershed nitrogen loading significantly increased to its present level due to the WWTF effluent plume reaching the Harbor. This temporal information can be used to determine the stability of the eelgrass community.”
“At present, eelgrass is present within both the inner and outer basins of the West Falmouth Harbor system. Based on the 2001 eelgrass survey conducted by the DEP Eelgrass Mapping Program the remaining eelgrass appears to be limited to an area just upgradient of the West Falmouth Harbor inlet as well as within Snug Harbor. However, the 1999 mapping and recent observations by MEP Technical Staff found that the Snug Harbor eelgrass is extremely sparse and exists in patches with < 5% cover. In contrast, the eelgrass in the outer Harbor basins is generally found in beds and the largest bed behind the northern jetty is dense and healthy. Observations of the outer/mid cove area adjacent Old Field Point (within the outer Harbor) does not support eelgrass beds in the inland most portion, although eelgrass is present in sparse patches not noted in the 2001 survey. However, the general presence or absence of eelgrass noted in the 2001 map was confirmed by the multiple MEP staff conducting the infaunal and sediment sampling and the mooring studies. The current decline of eelgrass beds relative to historical distributions is expected given the high chlorophyll a and low dissolved oxygen levels, as well as water column nitrogen concentrations within this system resulting from the watershed nitrogen loading to Mashapaquit creek and direct discharge to Snug Harbor.”
“In contrast to recent surveys, it appears that a substantial area of the overall West Falmouth Harbor system supported eelgrass beds in 1951 and 1979. The 1979 survey, which was field validated, showed similar coverage to the 1951 analysis. Similarly, the field survey of 1999 shows similar coverage to the 1995 and 2001 analyses. This agreement indicates that eelgrass loss within West Falmouth Harbor has been relatively rapid, occurring over a period of less than 20 years.
West Falmouth Harbor Historical Changes
[additional text to be added]
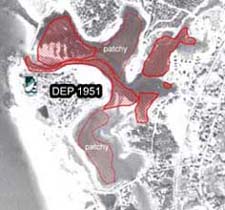
Eelgrass in West Falmouth Harbor, estimated for 1951 by DEP, and displayed on a 1955 photograph (source photograph was not available, Click image to enlarge.
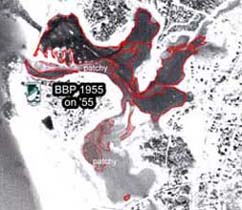
Eelgrass in West Falmouth Harbor, estimated by the BBNEP for for for 15 November, 1955. Click image to enlarge.
Eelgrass in West Falmouth Harbor, estimated by the BBNEP for 14 October 1981. Note that eelgrass beds in photographs taken between December and May appear much sparser than beds in the summer and fall.
