Sub-page: Hazardous Material Transport
Buzzards Bay and the Cape Cod Canal are part of the Atlantic Intracoastal Waterway, and therefor are important shipping passages for maritime commerce. Millions of tons of cargo are shipped through Buzzards Bay and the Cape Cod Canal annually, and hundreds of thousands of tons of goods are shipped in and out of New Bedford as well. Table 1 summarizes tonnage of various commodities that passed through the Cape Cod Canal in 2016, broken down by domestic and foreign shippers. As shown, in that year, 93% of the tonnage was domestic, and 79% of the tonnage was petroleum products like gasoline, kerosene, and fuel oil.
| Table 1. Cape Cod Canal cargo tonnage for 2016. | |||
| Commodity | Domestic | Foreign | Combined |
| All Commodities | 6,375,257 | 499,552 | 6,874,809 |
| Coal & Lignite | 43,088 | 0 | 43,088 |
| Gasoline | 1,601,011 | 102,711 | 1,703,722 |
| Kerosene | 976,063 | 0 | 976,063 |
| Distillate Fuel Oil | 1,850,726 | 134,801 | 1,985,527 |
| Residual Fuel Oil (heavy) | 487,720 | 14,691 | 502,411 |
| Lube Oil & Greases | 0 | 15,549 | 15,549 |
| Naphtha & Solvents | 26,826 | 13,053 | 39,879 |
| Asphalt, Tar & Pitch | 0 | 34,512 | 34,512 |
| Petroleum Coke | 0 | 151,282 | 151,282 |
| Alcohols | 1,093,087 | 0 | 1,093,087 |
| Sodium Hydroxide | 32,627 | 0 | 32,627 |
| Iron & Steel Scrap | 14,895 | 0 | 14,895 |
| Cement & Concrete | 245,992 | 0 | 245,992 |
| Vehicles & Parts | 0 | 32,933 | 32,933 |
| Manufac. Prod. NEC | 3,222 | 20 | 3,242 |
The U.S. Army Corps of Engineers Waterborne Commerce Statistics Center also aggregates this data into eight commodity groups in their annual commerce reports (see their 2016 Waterborne Commerce Statistics report). For example, gasoline, kerosene, and fuel oil are considered “petroleum and petroleum products”, and “chemicals” include non-petroleum hydrocarbons (alcohols and solvents), chemical salts, fertilizer, and other chemicals. A detailed table defining how commodities are broken up into these categories are found in Part 1– Waterways and Harbors Atlantic Coast commerce report. Fig. 1 shows a summary for the major commodity categories passing through the Cape Cod Canal as reported in an Army Corps commerce report.
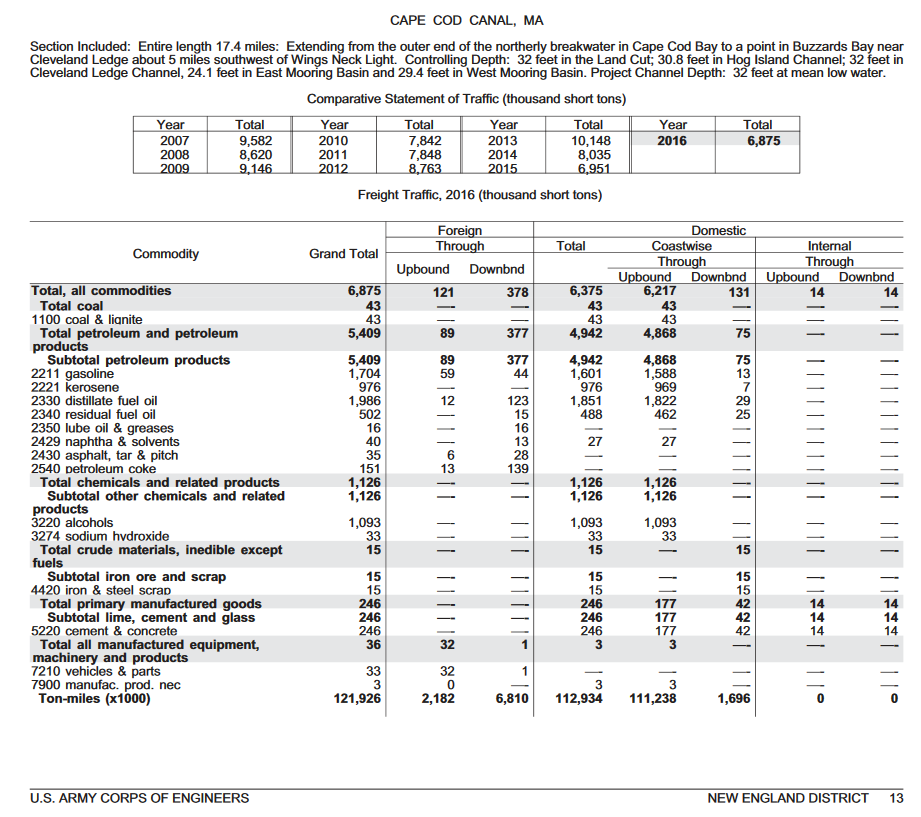
Fig. 1. Summary of up-bound and down-bound traffic in the Cape Cod Canal, broken down by major commerce group. From Part 1– Waterways and Harbors Atlantic Coast.
The type of vessel carrying these commodities varies, but most of the commerce-related trips through the canal are accounted for by tow vessels and non-self-propelled vehicles as shown by Fig. 2.
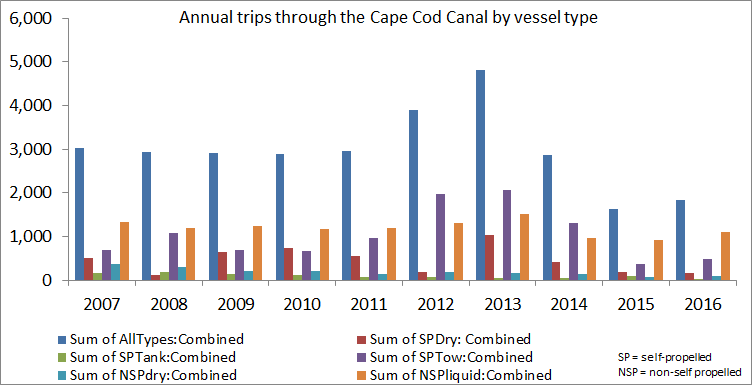
Fig. 2. Total annual trips (both north and south) through the canal by commodity transport vessel type. Date from: www.navigationdatacenter.us/wcsc/webpub/#/locations
Domestic and foreign commodity tonnage varies each year (Fig. 3) and is likely affected by commodity prices, land shipping costs, local demand, and various other economic factors.
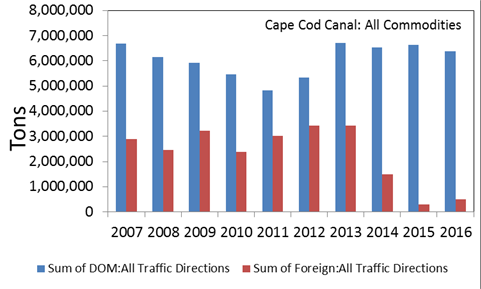
Fig. 3. Short tons of all commodities passing through the Cape Cod Canal.
Most commodity traffic is north through the Cape Cod Canal for delivery to Boston, or other points north, as illustrated by the transport of petroleum products (Fig. 4) and chemicals (Fig. 5).
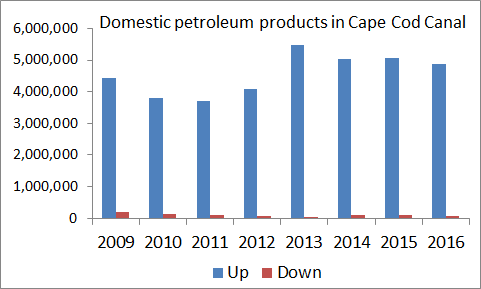
Fig. 4. Shipments of petroleum products up and down the canal, 2009-2016
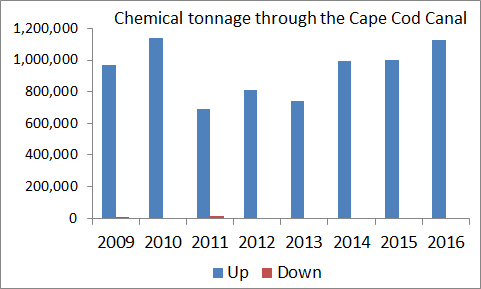
Fig. 5. Chemical shipments through the Cape Cod Canal.
Besides the Cape Cod Canal, a considerable tonnage of commodities moves in and out of New Bedford Harbor. Some of this tonnage may be shipped to the south, or north through the Cape Cod Canal. The relative proportions of the commodity categories shipped into and out of New Bedford Harbor differs from what passes through the Cape Cod Canal as illustrated by Fig. 6. As shown, petroleum products, crude materials, and food account for nearly all the tonnage. What accounts for the various the tonnage in the various categories may surprise you. for example, in the food category, tens of thousands tons of clementines are shipped into New Bedford from Spain and Morocco and transported by truck throughout the northeast and Canada. The crude materials includes thousands of tons of scrap iron that is sold to China.
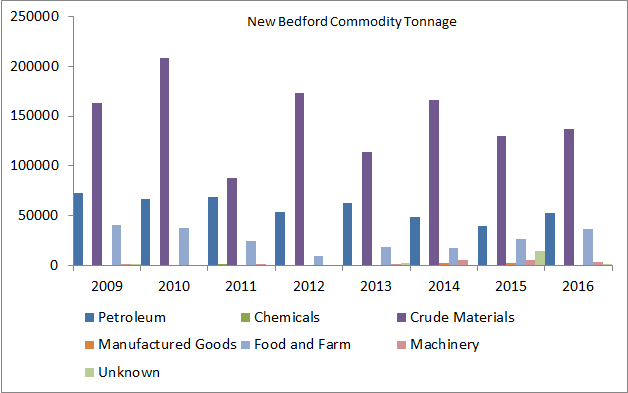
Fig. 6. Commodities (short tons) shipped into and out of New Bedford. Neither the coal nor waste categories were reported for any year. The crude materials likely include scrap iron.