Related pages: Interactive map of marsh monitoring sites | Migrating salt marshes | Tidal Elevations and Datums in Buzzards Bay | Tidal Datums and the HTL (last updated 22 April 2025)
On this page is an interactive map show tidal datum elevations along the coast of Massachusetts. All elevations (from VDatum online v4.7) in feet are relative to the NAVD 88 datum (zero) reference elevation. In the popup for each point, we list all relevant tidal datums. Zoom in and click on any point and a table of elevations will pop up for that location. The tidal datum elevations shown are mean high water (MHW), mean low water (MLW), local mean sea level (LMSL), mean tide level (MTL, average of MHW and MLW, and very close to LMSL), mean higher high water (MHHW), mean lower low water (MLLW), mean tidal range (MN), and salt marsh range (MARSH RNG), based on the formula HTL-LMSL. HTL calculated as described on buzzardsbay.org/technical-data/tidal-datums-ma/. Lowest marsh elevation is generally near the LMSL elevation but may be as high in the LiDAR data set as the field MAX_LM_FT (=LMSL+MN/3). The last field is the Z* elevation of the estimated high tide line using the formula ZSTAR_HTL = (HTL−MSL)/(MHHW − MSL).
Go to our Tidal Datums of Massachusetts page for an explanation of the regulatory and ecological relevance of these elevations. The data on this page was generated by the NOAA’s VDatum software which does not include tidal datum estimates for many embayments. Tidal datums in these areas are generally close in elevation to the outer coast, except in very large estuaries, or near tidal freshwater rivers. VDatum is a model with estimated uncertainties. Estimates are most accurate near the coast. Conditions within upper areas of estuaries and tidal rivers have greater uncertainties and may not be based on hydrodynamic models. For project engineering plans along the coast, elevations should be tied to local published benchmarks.
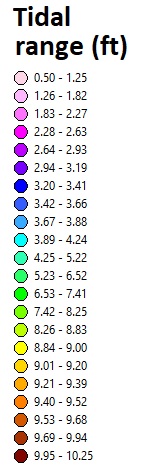
Zoom in and click on a point of interest. The popup table will summarize the estimated tidal elevations for that location. Elevations are in feet referenced to the NAVD 88 datum, GEOID 18. Points color coded for mean tidal range (MN).
This page was first posted June 22, 2017, and has undergone a number of revisions. This 2025 update is based on the latest VDatum model (4.7) and all data is now in GEOID 18. The tidal ranges are color coded in the above map according to this key. The data on our map can be downloaded as a kml file or a zipped shapefile.
Atlas
Atlas with 2025 update is not available
How to use this information.

Once you have identified the tidal datum of interest for a site, go to the NOAA website https://coast.noaa.gov/dataviewer/#/. Zoom into the interactive map until the view area is a few miles across. With the pencil tool, draw a box around your area of interest. The box should be at least a km across. Select a LiDAR data set and place it into your shopping cart. Click on your cart and proceed to checkout (the data is free). On the drop-down menu “Output Product” drop-down, select “Contour”; on the “Contour Format” drop-down select “Single Elevation, ” and in the Single Elevation box enter your tidal datum elevation. Most other fields will not need to be changed. After you submit your order, you will be emailed a link to download a shapefile with your data. If you do not own GIS software, websites are available that will allow you to convert shapefiles to Google Earth files (kml or kmz format), which will allow them to be viewed on your device with Google Earth installed (a free program).
Sea Level Rise Adjustments to These Model Estimates
The values are based on the NOAA VDatum model and are calculated for the present National Tidal Datum Epoch (NTDE; 1983 through 2001). Because of sea level rise, for any given predicted tide, actual tidal levels measured today would be about 5 cm greater in NAVD88 meters than the model estimates reported here. NOAA is in the process reviewing and analyzing tidal records at Newport and Woods Hole, and are expected to release new NTDE in 2026, and elevations relative to NAVD88 elevations will change then. Keep in mind that for sea level rise, tidal datum elevations relative to MLLW remain constant, but the elevation of MLLW relative to the NAVD88 vertical datum increases. The adjustment to the NTDE may modestly affect the boundary definition between private and publicly owned lands, regulatory jurisdiction of wetland permitting, flood stage action levels, flood insurance, and other regulatory and non-regulatory policies. For more information, go to the NOAA website.
This analysis and interactive map were prepared by Joe Costa. Report any issues to joe.costa@mass.gov.