by Joe Costa, posted June 22, 2017, last revised July 5, 2017
The precise elevation that the lower salt marsh begins with respect to geodetic vertical datums or tidal datums has no regulatory significance, but it is an interesting question for scientists studying the effects of sea level rise, pollution, and biological and physical disturbances to salt marshes.
In salt marshes, the elevation of the lower marsh boundary is not at a fixed elevation and varies with many factors including tidal range, coastal erosion, wave exposure, winter icing, storms, grazing, and other physical and biological factors, and can vary within different areas of the marsh. As noted on our tidal datums of Massachusetts page, the lower marsh boundary is generally characterized in scientific publications as beginning at the local mean sea level (LMSL; McKee and Patrick, 1988), but occasionally the lower edge is referenced to other tidal datums like the “mean high water at neap tide” line as described in Ranwell (1972) and at the Sea Level Rise in CT Salt Marshes website.
In Buzzards Bay, when LiDAR data is compared to the NOAA VDatum tidal elevation model, the lower boundary of salt marshes seems to be mostly bounded between near LMSL and a few inches to a foot above. However, using LiDAR to estimate boundary elevations in marshes in this way is challenging because of numerous confounding issues. These issues include the fact that LiDAR imagery may not be precisely georeferenced to aerial imagery, LiDAR does not precisely measure bare earth in salt marshes, LiDAR point data is aggregated across salt marsh banks, and it can be difficult to distinguish between living and dead marsh peat in aerial photographs. Even making field observations of salt marsh vegetation elevation along marsh banks can involve value judgments. For example, in Fig. 1, Spartina alterniflora grows to a general elevation, but some clumps of vegetation grow lower, and individual shoots may grow lower still. Sometimes vegetation may be observed to grow down a marsh creek bank during a growing season if the site was altered by storms or winter icing, so the time of observation can be important.
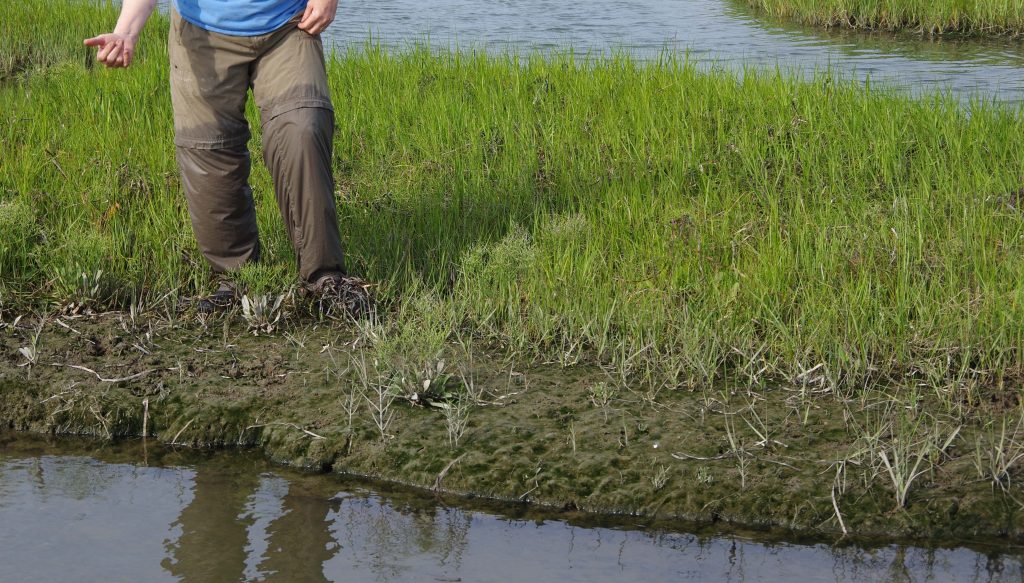
Fig. 1. Tidal bank defining the low marsh boundary at a site in the Westport River on 22 July 2016. Note that while the vegetation terminates at an approximate general elevation, some shoots may grow to lower elevations as shown here. Moreover, as new shoots grow during the summer, the vegetation may grow somewhat down the bank, particularly if the site is recovering from harsh winter conditions or other disturbances. Note also that the marsh vegetation in the foreground is about a foot above the water level, but the marsh in the background is to the water level. Photo courtesy of Chris Neill.
The elevation of low marsh can vary within a salt marsh. Fig. 2 shows the boundary elevations estimated by intersecting the apparent boundary observed on an aerial photograph with a LiDAR data set. Note how the vegetation boundary of marsh pools (and former marsh pools exposed by erosion) and certain protected areas are at a higher elevation than other areas. As a generalization, the lowest limit a salt marsh may grow is near the LMSL (+/-), but it is not uncommon to find the low marsh boundary elevation up to 1 to 3 feet above this elevation in Massachusetts depending on tidal range and other factors.
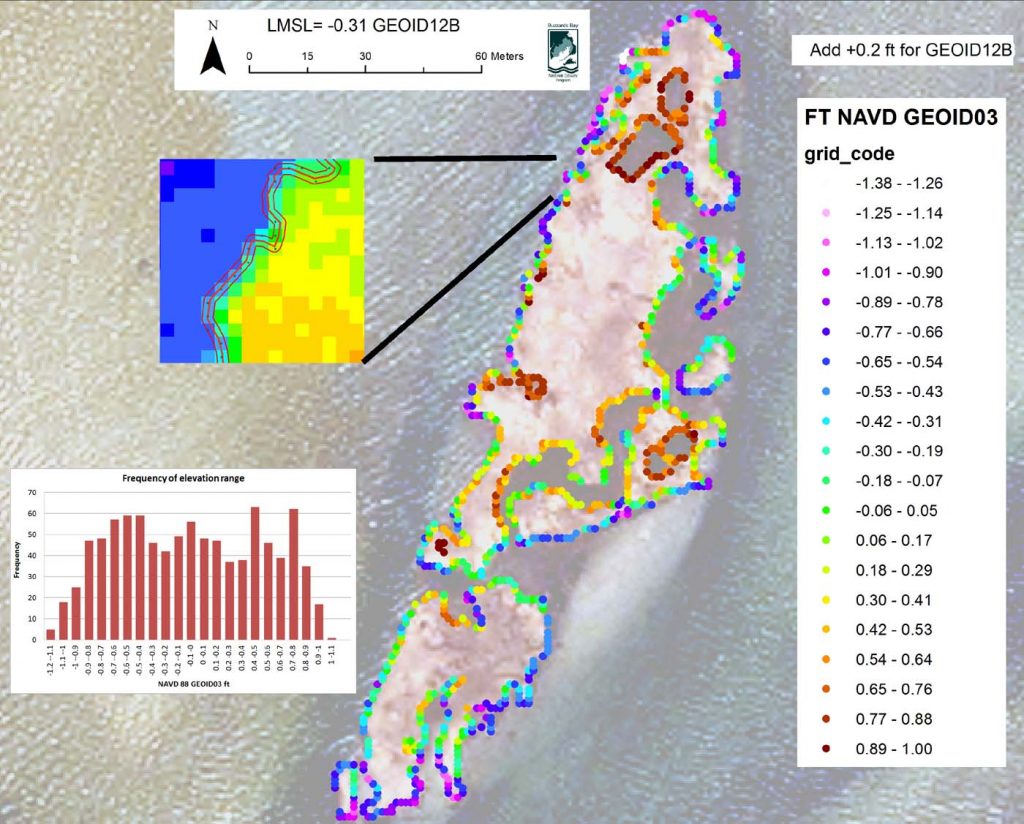
Fig. 2. Varied boundary elevation of a salt marsh island in the Westport River estimated by intersecting apparent boundary observed in a 2005 aerial photograph against 2006 LiDAR data. The LiDAR DEM elevations are in GEOID03. To get GEOID12B elevations for this site, add 0.2 ft. Local mean sea level for this site is -0.31 ft GEOID12B, and the arithmetic mean for all boundary points is +0.26 ft GEOID12B. Click to enlarge.
The Grass Canopy in LiDAR
When using LiDAR data to evaluate marsh elevations, it should be kept in mind that although coastal LiDAR surveys are typically undertaken during “leaf off” periods before the growing season begins, dead grass in a salt marsh forms a canopy that prevents the detection of the ground. In the upper marsh, the depth of the Spartina patens canopy is typically 6-10 cm in our area (Fig. 3). Tidal wrack can also add to this canopy depth somewhat. Most LiDAR bare earth models do not account for this grass canopy. In contrast, to higher marsh areas, very low salt marsh areas and marsh banks can be denuded of dead vegetation because of ice scour or winter storms, so LiDAR data might provide true “bare earth” elevations at those locations. Other issues associated with LiDAR data are that surveys are not always performed at low tide, and data is aggregated to form 0.7 to 2 m pixels, so that an apparent observed boundary may consist of an average elevation of higher vegetated and lower non-vegetated areas. The grass canopy issue and the averaging of elevations near the boundary may contribute to marsh LiDAR elevations being somewhat elevated as compared to RTK GPS elevations, or standard survey to benchmarks. Another problem in marsh boundary interpretation that we recognized during our collaborative study on salt marsh loss in Westport, is that it is often impossible to discern dead salt marsh peat in both LiDAR data and aerial photographs taken outside the marsh growing season.
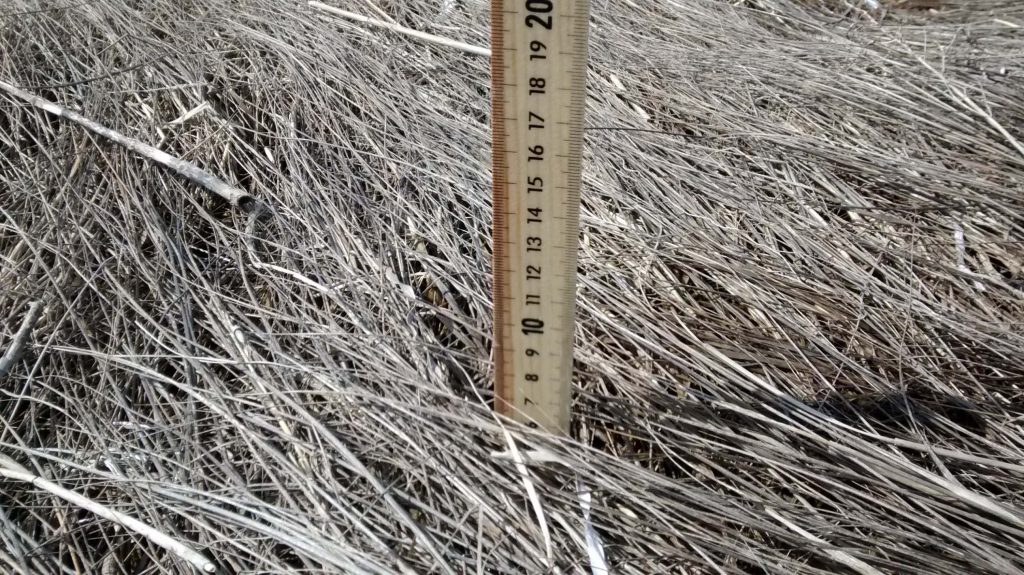
Fig. 3. Dead Spartina patens canopy in Sippewissett Marsh, April 2015. Photo by Joe Costa.
Site specific observations
When LiDAR elevations of the low marsh boundary in different parts of Massachusetts are compared to the VDatum tidal model, at many sites, the low marsh boundary appeared near (above or below) the LMSL elevation. However, at some other sites, the low marsh boundary LiDAR elevation appeared nearer to LMSL plus 33% of the mean tidal range (MN) or 30% of the great diurnal tidal range (GT) added. This latter elevation appears close to the “mean high water at neap tide” tidal datum. These limited observations suggest that in Massachusetts, the low marsh boundary will likely be observed between LMSL and LMSL+ 0.30 x GT.
For example, in the West End of Provincetown Harbor, some portions of the low marsh boundary (Fig. 4) appear near local mean sea level (roughly -0.4 feet or -0.13 meters NAVD 88, GEOID12A).
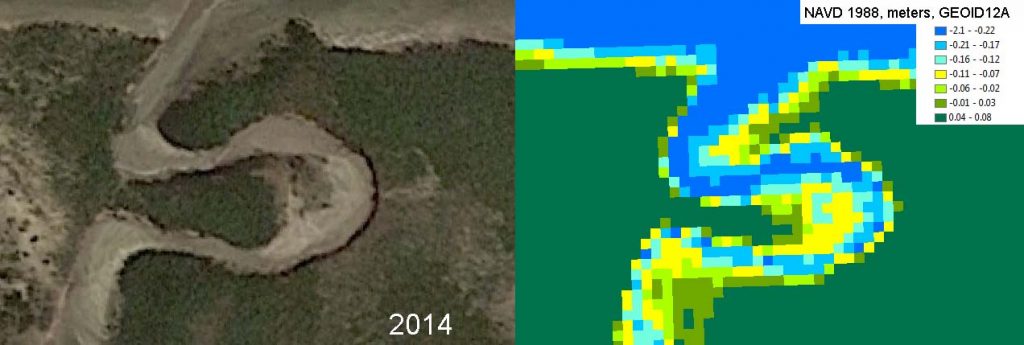
Fig. 4. Left: Spring 2014 image of a portion of the marsh at the West End of Provincetown harbor (behind the breakwater). Right: LiDAR image circa 2013 or 2014 of the same are showing pixel elevations in NAVD 88 meters (GEOID12A). Click to enlarge.
However, when another area of the West End is examined (Fig. 5), while some areas like the small island (top center) appear to have boundaries near LMSL (-0.13 m, compare to key, = -0.4 ft), some areas, like the “cove” in the lower right, have a boundary closer +0.21 to +0.40 in the key (1-2 ft higher the LMSL, red and orange colored pixels; compare to aerial image).

Fig. 5. Left: Spring 2014 image of another area of the West End Provincetown. Right: LiDAR image circa 2013 or 2014 of the same are showing pixel elevations in NAVD 88 meters (GEOID12A). Click to enlarge.
At a portion of a marsh in Ipswich (Fig. 6), LiDAR data elevations of the marsh appeared to be principally between 2.0 and 3.0 ft NAVD 88 (red pixels, Fig. 3). At this site, LMSL is at -0.4 ft NAVD 88, and the great diurnal tidal range (GT) was 9.5 ft. GT x 0.30 + LMSL = + 2.5 ft NAVD 88, which agrees with Fig. 3.
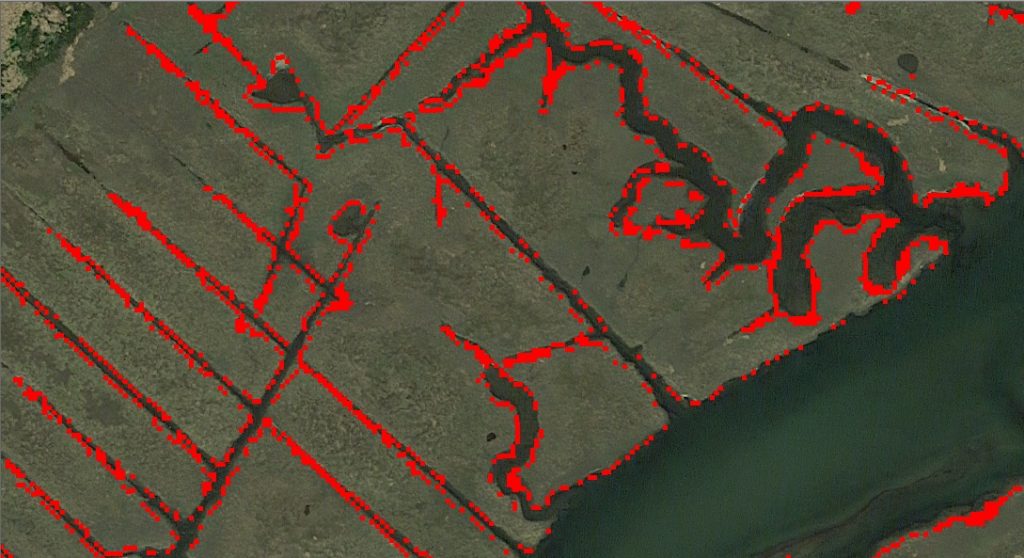
Fig. 6. Marsh in Ipswich showing LiDAR data elevations between 2.0 and 3.0 ft NAVD88 (red pixels).
In a lower tidal regime area like Wareham, LMSL is at -0.47 ft NAVD, but the marsh elevation in the LiDAR data set was observed closer to +0.8 ft (Figs. 7 and 8). The great diurnal (GT) tidal range is 4.4 ft at this site, and GT x 0.30 + LMSL was also good predictor of the marsh edge of this site. Note however, in Fig. 8, there is an apparent sloping peat bank. October 10, 2016 Google Earth imagery (not shown) suggests the living marsh ends within the red boundary line, with a mostly unvegetated sloping bank, which is fringed subtidal algae.
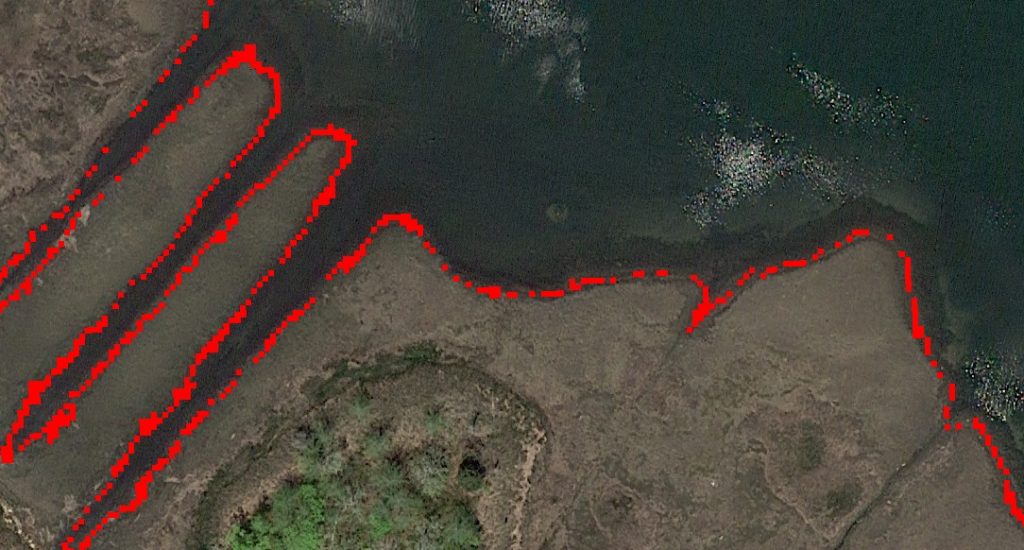
Fig. 7. A Wareham site show the low marsh boundary superimposed with 0.68 to 0.98 ft NAVD 88 LiDAR elevations for a site in Wareham. LMSL is -0.47 ft at this site.

Fig. 8. Detail of Fig. 7, showing a 2014 image during high tide (left, likely taken in June 2014), the same site during March 2014 during low tide, and showing clearly the top and base of the marsh bank (middle), and the LiDAR digital elevation model for a survey conducted at about the same time. The red line shows what might be interpreted as the approximate maximum extent of living marsh from the June 2014 aerial. Note that the marsh boundary appears to begin at mostly above the +0.21 to +0.3 meter elevation interval (+0.68 to +0.98 ft NAVD 88), and perhaps beginning within the 0.41 to +0.5 m elevation. Click to enlarge.
At both the Wareham and Ipswich sites, the formula MN x 0.33 +LMSL (where MN= MHW-MLW) was equally a good predictor of the highest boundary of the low marsh starting elevation.
Summary
Based on a review of a limited number of sites examined, and published studies, the LiDAR elevations of the boundary of the low marsh in Massachusetts, when compared to the VDatum tidal elevation model, will most likely be bracketed between LMSL (+/-) to up to roughly one third of the mean tidal range added to LMSL. Variations in the low marsh boundary elevation likely relate to numerous physical and biological factors.
It is worth stressing that all these LiDAR elevation estimates are subject to all the potential errors associated with interpreting LiDAR data as described above. These uncertainties also include elevation errors specific survey dates and flight lines, and known estimated uncertainties in elevation when compared to ground control points. Different LiDAR data sets may also yield somewhat different elevations. VDatum also has known estimated uncertainties, and in Massachusetts, these are estimated to range from 3 to 11 cm for different datums and conversions. The elevations reported here were not adjusted for dead grass canopy height. As noted above, besides tidal range, other factors such as channel erosion, wave action, pollution, and herbivory may also help define the lower marsh boundary elevation observed at any particular site.
References
McKee, K. L., and W. H. Patrick. 1988. The relationship of smooth cordgrass (Spartina alterniflora) to tidal datums: A review, Estuaries, 11(3), 143–151, doi:10.2307/1351966
Ranwell, D. S. 1972. Ecology of salt marshes and sand dunes. 1972 – Chapman and Hall – London
Sea Level Rise in CT Salt Marshes at https://sites.google.com/site/ctsaltmarshes/ (last accessed 27 June 2017).