Historical Changes in Eelgrass Abundance and State of the Bay Scores
by Dr. Joe Costa (last updated July 18, 2022)
Beginning with the 2003 State of Buzzards Bay Conference, the Buzzards Bay NEP estimated historical changes of eelgrass cover in Buzzards Bay from the 1930s to the present day based on aerial photographs, data from sediment cores, and anecdotal information contained in earlier reports. While aerial photographs of Buzzards Bay date to 1938, early aerial surveys generally cover only portions of Buzzards Bay, or the quality of the imagery is insufficient to fully map eelgrass, particularly deeper habitat area. Consequently the 2003 analysis (and later ones) included estimated bay-wide trends based on projecting changes in areas where the photographic record was more complete. In the 2003 report, we also included a more speculative assessment of what eelgrass habitat area might have been in pre-colonial time when Buzzards Bay was pristine. This pre-colonial habitat area was based on the presumed depth that eelgrass could grow in different parts of the bay during presumed pristine water quality conditions. These areas were then multiplied times coefficients of the likely percent cover of eelgrass in these areas. This pre-colonial estimate of eelgrass bed habitat area was assigned a score of 100, and in the 2003 report we assigned a score for eelgrass abundance in Buzzards Bay by dividing the estimated 2003 eelgrass bed habitat area by the conjectural precolonial eelgrass habitat area (and multiply by 100). The conjectural eelgrass cover in the 2003 report was 23,861 acres. For the 2022 State of the Bay report we revisited this analysis using better bathymetric information, and more conservative assumptions about the maximum depth eelgrass could grow as described in the section below.
Maps and areas of eelgrass cover were generally based on Mass DEP survey GIS data, supplemented or modified by the Buzzards Bay NEP. In the 2007, 2011, and 2016 Buzzards Bay Coalition State of the Bay reports, the Buzzards Bay NEP repeated the process of estimating eelgrass habitat area based on the latest and best available information for each period. For most State of the Bay reports, available eelgrass maps were often out of date, partly because there was often a lag between when aerial surveys were flown, and when they were interpreted. For the 2003 State of the Bay report, the score was based on DEP’s 1995 eelgrass survey, which was made available publicly about 1999. For the 2007 report, we used a 2001 survey coverage, which was available about 2004. For the 2011 State of the Bay report, the score was based on eelgrass beds mapped by DEP in selected embayments using a 2006 aerial survey, and using pre-released draft data from DEP for a 2010 aerial survey of selected Buzzards Bay embayments (courtesy Charles Costello). Because the DEP surveys often did not include all of Buzzards Bay, and to identify any areas of appreciable change, the BBNEP often reviewed aerial imagery flown after the date of the DEP survey, to supplement or fill in gaps in coverages, or we projected trends from available mapped areas.
For earlier State of the Bay reports, we estimated general decadal trends of changing eelgrass habitat area in Buzzards Bay during the 20th century based on selected embayments using archived aerial photographs and sediment core data of eelgrass seed abundance as reported in the Costa 1988 reports. Our analysis took into account the 1931-32 wasting disease that destroyed at least 90% of eelgrass beds in the North Atlantic, but in Buzzards Bay likely destroyed closer to 99% of its eelgrass cover based on some early reports of the event. Bay wide aerial surveys of Buzzards Bay were not commonplace until after 1994. After 2001, color high resolution aerial imagery of Buzzards Bay became readily available with increasing frequency. These aerial surveys, together with MassDEP’s eelgrass surveys, and new underwater photo surveys are allowing for a better understanding of eelgrass habitat changes during the past twenty years. To support the Buzzards Bay Coalition’s 2021 State of the Bay report, the Buzzards Bay NEP reevaluated some older data sets, reevaluated assumptions about precolonial conditions in Buzzards Bay, and applied the new MassDEP 2017 and 2021 eelgrass habitat GIS coverages. In the sections below, I highlight the data used, methods, and other considerations relating to mapping eelgrass in Buzzards Bay.
Costa 1988 EPA Report in Thesis Data
With funding from the Buzzards Bay Project in 1985, Costa mapped current and historical distribution of eelgrass in Buzzards Bay based on field surveys between 1983 and 1987, historical aerial photographs between 1938 and 1983, and sediment cores (Costa 1988a, 1988b). A description of the methodologies used and the limitations of using older aerial surveys are found on the eelgrass GIS data page. Important considerations when evaluating old aerial photographs include whether or not the photographs were taken too early in the growing season to enable easy visualization of annual eelgrass beds, whether or not a recent hurricane or winter icing affected eelgrass abundance in shallow waters, and whether or not water transparency is adequate to enable visualization of the lower edge of the beds.
The 1988 eelgrass reports included historical changes of eelgrass abundance for selected sites. More recently, the Buzzards Bay NEP has been scanning and registering original source photographs and acquiring others, and using current GIS software and methods, creating new GIS coverages of eelgrass change that will be posted on this website.
1931-1932 wasting disease
A “wasting disease” destroyed virtually all eelgrass in Buzzards Bay (and elsewhere in North America) during 1931-32. Most reports suggest that on average 1% of the eelgrass bed cover pre-wasting disease survived. The disease appears to have been caused by a virulent cellular slime mold that might have been introduced to the Atlantic or facilitated by exceptionally warm weather during those summers. All documentation suggests that eelgrass populations equaled or exceeded present-day abundance prior to this catastrophe. Photographs taken 6 to 10 years after the disease show that eelgrass covered less than 10% of the present-day habitat area in Buzzards Bay (although many of these areas may have been affected by the Hurricane of 1938), and many areas appear not to have been recolonized for decades. Most areas of Buzzards Bay appear to have fully recovered from the wasting disease by the mid 1960s.
The process of recolonization was similar in many areas: new beds initially appeared on bare substrates, beds expanded, additional new beds appeared, and some beds were removed by disturbance. In this way eelgrass population saturated small areas (1-25 acres) 5 to 15 years after initial colonization. Rates of eelgrass colonization over larger regions (100s of acres) depended on distance from refuge populations and heterogeneities of the environment. The greatest rates of eelgrass expansion occurred during the 1950s and 1960s. Most available substrate was saturated by the 1980s, but eelgrass continued to expand in some areas, or show new pollution-related declines in others.
First DEP Eelgrass Survey vs. the 1980s Survey
DEP first conducted an aerial survey to map eelgrass in Buzzards Bay in 1995 (a recommendation in the 1991 Buzzards Bay Comprehensive Conservation and Management Plan) using photographs from about June 1, 2005. One limitation of an early aerial survey is that functional annual eelgrass beds (that is, those growing from seed) may not be established in certain shallow areas. While DEP did conduct field surveys during the following summer, field surveys can only corroborate the presence or absence of eelgrass, although DEP did visit hundreds of sites in Buzzards Bay.

Comparison between the Costa 1980s and DEP’s 1996 mapped distribution of eelgrass.

Comparison between the Costa 1980s and DEP’s 1996 showing decline in eelgrass cover in the Wareham area

Comparison between the Costa 1980s and DEP’s 1996 showing decline in eelgrass cover in the West Falmouth Harbor area.

Comparison between the Costa 1980s and DEP’s 1996 showing increase in eelgrass cover around Clarks Point New Bedford area. This was one of the few areas of increase between the two surveys and may have resulted from the improvements to the wastewater facility, and perhaps more importantly, the elimination of dry weather discharges from CSOs on both sides of Clarks point.
The first DEP survey showed considerably less eelgrass in Buzzards Bay than the 1980s reports. Conclusions about the locations of eelgrass in new DEP surveys as compared to the 1980s map were difficult because with maps only available for two dates, it was unclear at the time whether the absence of eelgrass at specific locations was due to eutrophication, date of aerial imagery, storms, disease, natural variability, or other factors, or from differences in the time of year or limitations or visual limitations of the aerial imagery. For example, the 1980s surveys were largely based on a October 1981 coastal aerial survey. In such early fall aerial photographs, annual and perennial eelgrass beds show the greatest contrast with background sediments because of high leaf and epiphyte biomass. This 1981 aerial survey was also undertaken mostly during a low tide, and with exceptional water clarity conditions in most areas, so that deep beds were also easily discerned. Because of these differences in the quality and conditions of the aerial surveys, it was difficult to determine whether the apparent absence of eelgrass at some locations in the 1996 survey was based on distribution of annual beds, pollution, disease, storm losses, or limitations of the aerial survey.
It was not until DEP repeated its eelgrass aerial and field survey in 2001 (released about 2004), and when we began reviewing other sets of aerial photographs, that it became apparent that much of the eelgrass losses documented in 1996 survey were genuine and likely due to eutrophication (like in the Wareham River and off Wareham’s Great Neck) and worsening (read this Codium versus Eelgrass off Great Neck article).
The subsequent 2001 aerial survey was flown somewhat later (mid-June), and this survey also had only average water transparency, so the full extent of deeper beds in offshore areas and deeper parts of harbors were remained unclear until more aerial surveys became available and were evaluated.
Development of Suplemental data by the Buzzards Bay NEP
In 2003, DEP also mapped eelgrass at a large number of sites in the Commonwealth using a 1951 state highway department aerial survey photograph set. These photographs were taken at a low altitude during the fall, and generally show good water transparency. Because many areas still had not recovered from the wasting disease (there is a dearth of eelgrass in the Marion and Wareham areas in the DEP coverage), this eelgrass cover should not be used to determine the possible maximum extent of eelgrass in pollution and nitrogen TMDL studies, especially if aerial surveys from the 1960s, 70s, or 80s show a greater extent of eelgrass cover. DEP has not yet made the 1951 eelgrass survey coverage available through the MassGIS website.
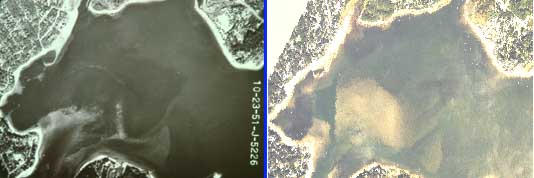
Buttermilk Bay eelgrass cover in October 1951 versus September 1994. Note how eelgrass dominates the flood delta in the 1951, but in 1994, the flood delta is bare (sandy color). The dark trapezoid feature west (left) of the flood delta is a deep area that had been dredged.
Shortfalls in agency funding have curtailed bay-wide eelgrass mapping efforts in Buzzards Bay by DEP. About 2008, DEP released a new survey of most embayment areas in upper Buzzards Bay based on 2006 aerial imagery. This coverage is available at the MassGIS website. A similar effort in a smaller number of embayments was undertaken using 2010 and 2013 aerial imagery. Surveys of 2017 and 2021 were largely bay-wide.
To expand the assessment of historic and current trends of eelgrass cover, the Buzzards Bay NEP has begun georeferencing and enhancing historic and recent aerial imagery of Buzzards Bay. Included in this effort, we have scanned in detail for the first time, photos from Costa thesis aerial archive, as well as downloaded new and archival photographs from various sources. Using ArcGIS 9.3, images were easily imported and georeferenced generally to within less than 10 ft of current MassGIS ortho base maps. Images were typically enhanced within ArcGIS by stretching raster histograms and changing brightness and contrast. This ability to enhance aerial images enabled visualization of deeper beds and deep edge boundary locations that were impossible to evaluate using tracing and transfer techniques common a decade ago. Bed boundaries were “heads up” digitized in the GIS software with the imagery magnified to capture eelgrass habitat boundaries and bare patches within beds, often with a point spacing less than 10 meters. This approach enabled us to create eelgrass habitat maps with a high degree of precision to the imported base maps. Because this fineness of detail was not consistent with some earlier DEP eelgrass coverages, in a few embayments the DEP eelgrass bed boundaries were reevaluated to better capture bed patchiness to ensure better consistency with new coverages developed. Similarly, eelgrass coverages digitized by Costa in the 1980s lacked the fineness of detail achievable through a reanalysis of that study’s original source photographs, so the newly digitized coverages on specific dates were substituted for the Costa survey files when possible.
Hypothetical Eelgrass Distribution during the Colonial Period
For the 2003 Coalition State of the Bay report, we estimated a conjectural eelgrass cover circa 1600. This estimate was needed because the Buzzards Bay Coalition uses percent of potential habitat as the basis of its habitat scores. This is a speculative exercise, but it was worthwhile to imagine the potential distribution of eelgrass in Buzzards Bay with better water transparency and without human impacts such as nitrogen loading, dredging, increased water turbidity associated with urban runoff, resuspension of sediments from boat traffic, and other human disturbances.
Eelgrass distribution is largely dependent upon water transparency. This is evident in the clear waters of offshore areas of Cape Cod and Islands, where eelgrass has been document to grow to 20 feet per chart sounding depths, and deeper depths of eelgrass beds have occasionally been recorded by divers. Today in less polluted and better flushed harbors and coves around Buzzards Bay, eelgrass beds typically grow to depths between 8 and 12 feet. In contrast, in most polluted embayments, eelgrass, if present at all, may only grow to depths of 6 feet MLW or often much less.
These patterns of growth became the basis of assumed eelgrass distribution in pristine conditions. Using the depth of growth of eelgrass in clean waters, we can speculate what eelgrass abundance in Buzzards Bay may have once been, and a hypothetical historical eelgrass habitat in Buzzards Bay can be postulated. Such hypotheses can even be tested using sediment cores because Costa (1988, 1989) and others have shown that the remains of eelgrass seed coats (tests) are a valuable biostratigraphical marker that remain in the sediments of many bays and harbors, possibly for many centuries. For example, no eelgrass has been found in inner Apponagansett Bay (Dartmouth) for decades, but sediment cores show eelgrass was abundant for centuries based on assumed rates of sedimentation (Costa, 1988a).
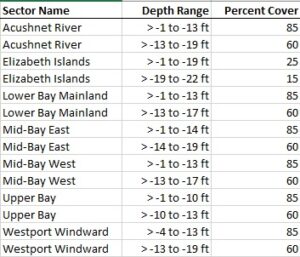
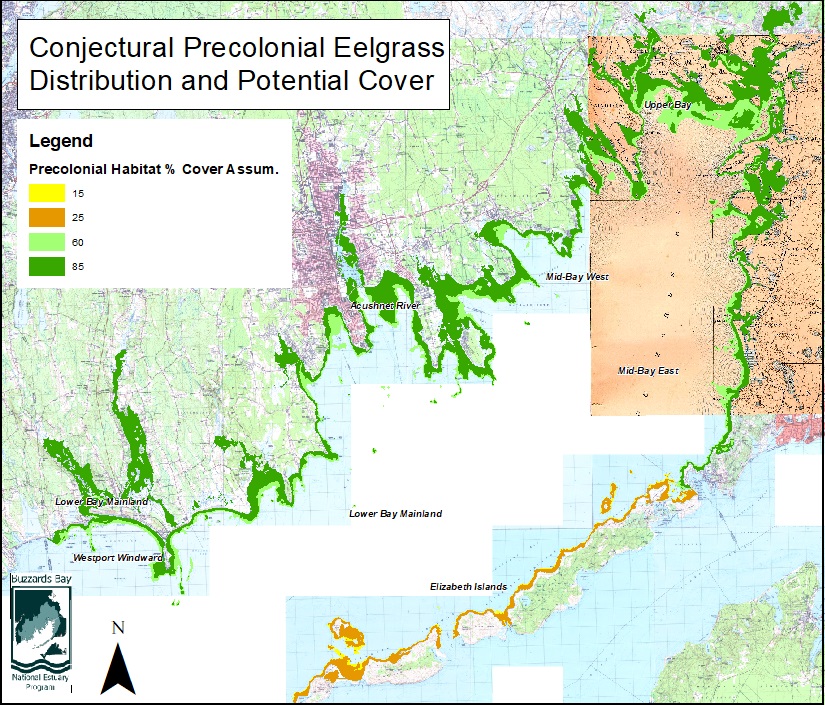
For the 2022 State of the Bay report, the Buzzards Bay NEP reevaluated its precolonial condition assumptions using a more recent bathymetric model for Buzzards Bay, and more realistic assumptions about the depth that eelgrass can grow. Because dredging is one cause of eelgrass habitat loss, for this new analysis the Cape Cod Canal and approaching channels were removed using 19th and early 20th century maps and nautical charts. While eelgrass might exist within a specific depth range, eelgrass beds may only cover a fraction of the delineated area just as it does today. The map below divides Buzzards Bay into seven areas. For all areas, eelgrass was assumed to grow in all areas greater than 10 ppt salinity beginning at a bathymetric depth of 1 foot, except for outer Westport harbor where eelgrass could not grow above 4 foot depth because of the high energy environment. The maximum depth eelgrass grows depends on water transparency. Areas with high river discharges and less flushing are naturally more eutrophic and have somewhat less water transparency. For this reason, the maximum depth eelgrass was assumed to grow in the upper bay (which lacked exchange through the Cape Cod Canal) was 13 feet (about 4 m), but areas with a depth less than 10 feet were assumed to have a higher likelihood of eelgrass cover (85%), versus the 10-13 foot depths (60% cover). The lower areas of Buzzards Bay have greater exchange with oceanic, waters and likely always had the best water transparency, as they do today. So, areas in the mid and lower bay, eelgrass likely grew to greater depths as they do today, growing down to 19 feet. While eelgrass can be found today along the Elizabeth Islands, much of the habitat around the islands is dominated by large boulder and cobble fields, so only 25% of that area was presumed to sustain eelgrass. Other assumptions are in the table and map below. This analysis is simplistic in that it ignores other factors, like the fact that sea level may have been lower by two feet or more in 1600.
Decadal Trends
One way to characterize eelgrass cover data is to assign a relative abundance score of eelgrass in each embayment relative to the peak coverage observed in any photograph. Thus, if eelgrass in 1951 covered 100 acres in a particular embayment in 1951, but only covered 60 acres in 1995, its score in 1995 would be 60. In the graph below, we show the average score for all embayments based on the average embayment score using all data during any particular decade.
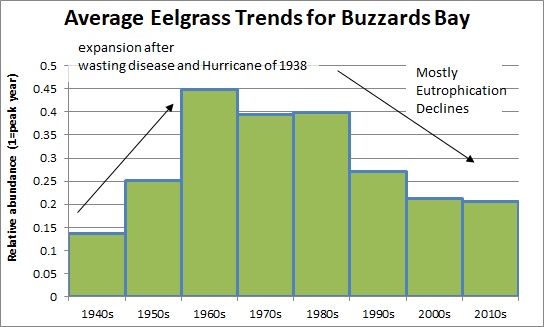
Historical summary of eelgrass in Buzzards Bay based on decadal average trends based on eelgrass bed areas measured on aerial photographs from each period. Certain biases are included in this summary, and when areas are matched in pairs for two dates, a somewhat different trend is expressed. For example, between 2001, and 2006 there was a 2.2% percent eelgrass decline, and between 2001 and 2009-10, there was a 17.0% decline. The decline continued between 2010 and 2017, but at a much slower rate.
The graph above incorporates certain biases. For example, embayments with large areas of eelgrass are weighted the same as embayments with only small amounts of eelgrass. Some parts of Buzzards Bay (such as the upper portions of Buzzards Bay) were mapped with more frequency, so these locations bias the trends. Finally, most of the recent data is for embayments. Eelgrass in well-flushed outer coastal areas does not show the same declines as many embayments, so these areas must be accounted for. Because the eelgrass score for Buzzards Bay is meant to track the trend of total eelgrass cover in Buzzards Bay (upper and lower bay, embayment and offshore beds), the data was characterized in a way to minimize some biases in the available data.
2021 State of the Bay report assumptions and data
Summary of past State of the Bay Eelgrass scores.
| SOB Report Year (year of data) | SOB Score |
| NA (1980s, various dates) | 43 |
| 2001 (1995 data) | 34 |
| 2007 (2001 data) | 25 |
| 2011 (2009 and 2010 data) | 23 |
| 2015 (2013 and supplemental data) | 23 |
| 2021 (principally DEP 2021) | TBA |
While this exercise is useful for characterizing and tracking environmental degradation in Buzzards Bay as part of the Coalition’s State of the Bay Reports, when it comes to taking action to evaluate nitrogen pollution impacts to Buzzards Bay embayments, scientists always review the specific known trends and known maximum extent of eelgrass coverage in each estuary. Click the links of the embayment names at the top of this page to see the actual trends for individual embayments.
Buzzards Bay Related Eelgrass Links and Reports on Historical Changes
Costa, J. E. 1988a. Eelgrass in Buzzards Bay: Distribution, Production, and Historical Changes in Abundance. EPA 503/4/88-002 204 pp (5.4 MB)
This report contains much the same information as the thesis work, except that it contains additional detailed embayment specific site histories.
DEP eelgrass interactive maps.
PDF fact sheet on Massachusetts DEP eelgrass mapping program, and the Wetland Conservancy Program