Related Pages: Nitrogen Loading Assumptions | Parcel Level Analysis
What is on this page
[This page was posted for a 2012 assessment of loading.]
On this page we present summary statistics of land use and wastewater characteristics prepared by the Buzzards Bay National Estuary Program for this watershed, and from these features we have estimated nitrogen loading using Massachusetts Estuaries Project nitrogen loading coefficients. We also include links to current and historical reports on pollution in the watershed issued or developed by the state, federal government, DEP, the Massachusetts Estuaries Project, non-profits, and independent scientists.
In our analysis, we have used attenuation coefficients contained in a draft Massachusetts Estuaries Project TMDL report. DEP has not yet approved the TMDL report for this watershed, and these attenuation coefficients may change in the final TMDL report.
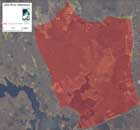
There are no subwatersheds delineated by the MEP within the Little River watershed.
Sewer and Septic Use
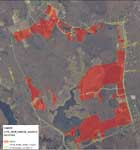
Click on wastewater service map for a larger image or open one of these files:
bbnep-septics-little-river.pdf (2.5 MB pdf)
little-river-septic-service.kmz (1.5 MB Google Earth file)
Water Service
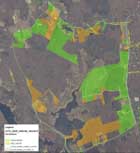
Click on water service map for larger image or open one of these files:
water-service-little-river.pdf (1.5 MB pdf)
little-river-water-serv.kmz (2.7 MB Google Earth file)
MassGIS 2005 Landuse
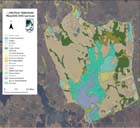
MassGIS 2005 land use is a useful coverage for estimating agricultural lands, pasture, and golf courses. Click on the map for larger image or open this pdf file:
little_river_2005_landuse.pdf (1.3 MB pdf)
Other Embayments
Little River, Dartmouth
New Bedford Harbor
Slocums River, Dartmouth
Wareham River
We hope the information on this page will give municipal officials, planners, and residents the opportunity to review our GIS work and data, and to help all to better understand any comments or analyses that we may convey to MA DEP or the US EPA. We also hope the information presented here will help convey a clear understanding of nitrogen loading characteristics for this watershed.
Evaluating watershed nitrogen loading is just one part of the process for establishing nitrogen TMDLs for impaired coastal waters. The Massachusetts DEP and EPA are setting these TMDLs based on studies being conducted by the Massachusetts Estuaries Project. More information about this effort can be found on the MEP Oceanscience.net site, UMass Dartmouth SMAST site, and this DEP TMDL page.
Watershed delineations
The 1,396-acre watershed used for the analysis presented on this page is the subwatershed adopted by the Massachusetts Estuaries Project, and is based on land surface topography defining a bedrock valley watershed. It is nearly identical to the watershed adopted by the Buzzards Bay NEP in 1990, and was based on subwatershed delineations developed and refined by Mass DEP and USGS in the 1980s and 1990s. See also our Buzzards Bay watershed boundary changes page for additional information.
Subwatersheds
This is a small watershed and the MEP did not delineate any subwatersheds, and the entire watershed is in the 0% nitrogen attenuation, 100% nitrogen transmission zone.
Characterization of Development from Assessors Data
There are 185 parcels with a meaningful portion of the parcel in the watershed, most of which are single-family homes. The table below summarizes the top 10 land uses. These totals include properties that straddle the watershed. Note that if the structure and presumed septic system location was outside the watershed, loading from that unit may not be included in the loading tables on this page.
| Use Code | Use Description | Count |
| 101 | Residences: Single Family | 110 |
| 132 | Vacant Land in a Residential Zone: Undevelopable Land | 25 |
| 130 | Vacant Land in a Residential Zone: Developable Land | 13 |
| 950 | Charitable: Vacant, Conservation Organizations | 12 |
| 109 | Residences: Multiple Houses on one parcel | 7 |
| 106 | Residences: Accessory Land with Improvement (garage, etc.) | 4 |
| 131 | Vacant Land in a Residential Zone: Potentially Developable Land | 3 |
| 718 | Agricultural/Horticultural (under 61A): Pasture | 3 |
| 930 | Municipal or County: Vacant, Selectmen or City Council | 3 |
| 104 | Residences: Two-Family | 1 |
| other | 4 | |
| Total | 185 |
There has been little development in this watershed in recent years.
| Year | buildings with wastewater |
| 2005 | 108 |
| 2010 | 108 |
This estimate includes structures with presumed wastewater service (sewer or septic) and does not include residential garages or other accessory commercial or residential structures.
Sewering and Septic Use
All properties in this watershed have onsite wastewater disposal facilities. The BBNEP estimates there were about 108 onsite (septic) systems total in both 2005 and 2008 in this watershed.
| Year | Buildings on Sewer* | Buildings on Septic | Units on Septic |
| 2005 | 0 | 108 | 108 |
| 2010 | 0 | 108 | 109 |
*The BBNEP does not attempt to estimate units in sewered areas.
Note that the number of units, buildings, and septic systems (below) may not be equal for any given watershed. There are generally more “units” in a watershed than “buildings” because a building may have multiple residential or building units. For example, a two-family dwelling may consist of two families (condos or apartments) in one structure, but that one structure may be served by a single septic system. For septic system loading calculations, units is the best value to use of the three parameters.
Residential Water Use
For the 63 of 92 single family home property (use code 101) in the Little River watershed that receive town water and whose septic systems are presumed in the watershed, the average annual water water use of these properties is 9,268 cubic feet or 189.9 GPD.
Impervious Area Calculations
In nitrogen loading calculations, analysts prefer to use actual roof and parking areas in town GIS coverages, but this data is not often available. Consequently, other estimates are used, and in the 1990s, the BBNEP often used an average roof area for each property of 1,500 square feet, and each driveway area of 1,500 square feet. The MEP used this methodology for many watersheds of Cape Cod and the Islands. The above impervious constants are not appropriate for commercial areas, and no a priori assumptions are adequate for older urbanized portions of watersheds. To address this problem, the BBNEP has begun using the MassGIS impervious cover coverage in our watershed loading estimates as described on this using MassGIS impervious coverage webpage.
This watershed has little impervious surface. Using the BBNEP methodology for impervious area (as illustrated by these coverages: little-river-imperv-parcels.kmz and little-river-imperv-roads.kmz), there are 10.22 acres of road and 16.60 impervious acres on the parcels (roof plus driveway). The MEP methodology of 1,500 sq. ft of roof and 1,500 sq. ft. of driveway on parcels would total 7.58 acres for the watershed. The underestimate for this methodology reflects the fact that homes in this watershed are quite large with long driveways.
Wastewater Facility and Other Permitted Discharges
There are no groundwater wastewater facility discharges in this watershed that require a state permit (i.e. none greater than 10,000 gpd). There are no wastewater facility discharges to surfaces waters in this estuary, and no NPDES permits are in place with EPA.
Nitrogen Loading and Land Use Spreadsheets
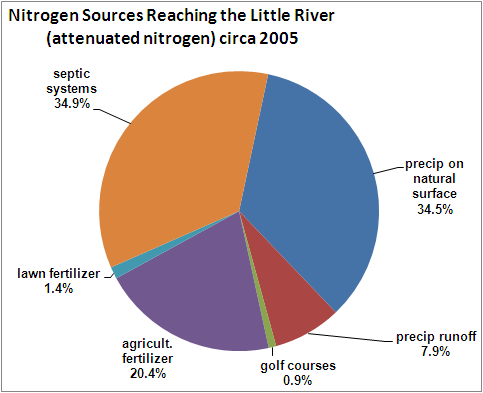
The Little River estuary 89.1 acres. The estuary and its surrounding watershed total 1396.3 acres. There are no upperwatershed subwatersheds with attenauation in this estuary watershed due to its small size, therefore this table and pie chart represent both unattenuated watershed loading and attenuated estuary loading. Note that there is a small sliver of a golf course that is included in the watershed boundary as currently defined by the MEP.
| Attenuated subwatershed loading (lbs) | sub id | precip on natural surface | precip runoff | golf courses | agricult. fertilizer | lawn fertilizer | septic systems | point sources | unatten total |
| little river | 0 | 1,459 | 333 | 37 | 863 | 58 | 1,475 | 0 | 4,225 |
Summary Pie Chart
The pie charts below show unattenuated loads to the watershed and attenuated loads to the estuary, based on 2005 conditions. For septic loading, a water use of 189.9 gpd (x 90% to adjust for non-wastewater use as per MEP methodology) was used in the calculation.
Sensitivity Analyses
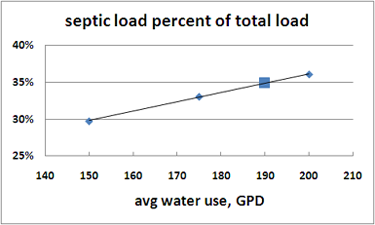
The water use for septic loading used for this watershed analysis is higher than the averages used by the MEP in most other studies. The figure below shows how total septic loading changes with water use.
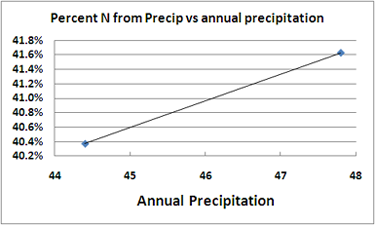
For most subwatersheds on Cape Cod, the MEP assumed that stormwater recharge from impervious surfaces was 40 inches per year (=90% of an annual total precipitation of 44.4 inches). Annual precipitation increases by several inches moving west away from Cape Cod, and for the New Bedford TMDL report, the MEP used an annual precipitation of 47.8 inches, with a 90% recharge, for a net recharge rate of 43 inches for impervious surfaces. This value was used for the summary presented here and the figure below shows how loading changes with precipitation.
Embayment area, bathymetry, and tidal range
This data was developed in the 1990s by the Buzzards Bay NEP.
| Embayment | Water area km2 | mean depth at MLW (m) | mean depth (m) at Half Tide | Vol. at MLW m3x10^6 | Vol. at Half Tide m3x10^6 | Tidal Range(m) |
| Slocums River | 0.35 | 0.58 | 1.13 | 0.20 | 0.39 | 1.10 |
Links to more information
Buzzards Bay Coalition: Interactive WQ Maps
Buzzards Bay Coalition: Wastewater Driving Slocums River WQ declines
Buzzards Bay Coalition Slocums River Water Quality Trends, 1993-2003
Buzzards Bay Coalition Baywatchers III poster
Buzzards Bay Coalition Baywatchers 1992-2005 Water Quality Atlas
Buzzards Bay Coalition Westport-Dartmouth Lands Campaign
Buzzards Bay landfill sites 2007 DEP MassGIS data as a Google Earth File; click on polygon for more info
BBNEP GIS Data
Parcels (joined to assessors, and water account data): littl_rivr_parc09_20dec2010.zip
Parcels along watershed divide that were split by watershed: littl_rivr_parc09_20dec10_split.zip
BBNEP December 2009 protected open space coverage: bbnep_openspace_dec09.zip (factored into the parcel coverage with some modifications).
Little River watershed: little_river_1shed_11jun10.zip
Subwatersheds: none
EOT Road Impervious: eotroads09_littleriv_p.zip
Parcel Impervious: imprv_littleriv_parc_only_28jun10.zip
Please review this loading spreadsheet that was used for this webpage: bbnep_nload_littleriver_22dec2010.xlsx
Please report errors or send comments about this page to Joe Costa.