Related Pages: Nitrogen Loading Assumptions | Parcel Level Analysis
[This page was posted for a 2014 assessment of loading.]
What is on this page
On this page we present summary statistics of land use and wastewater characteristics prepared by the Buzzards Bay National Estuary Program for this watershed, and from these features we have estimated nitrogen loading using Massachusetts Estuaries Project nitrogen loading coefficients. We also include, where available, other estimates of loading, as well as links to any current and historical reports on pollution in the watershed issued by the state, federal government, DEP, the Massachusetts Estuaries Project, non-profits, and independent scientists.
In our analysis, we have used attenuation coefficients contained in a draft Massachusetts Estuaries Project TMDL report. DEP has not yet approved the TMDL report for this watershed, and these attenuation coefficients may change in the final TMDL report. Please note that the MEP report for this estuary (posted as complete on the www.oceanscience.net/estuaries/Slocums-Little.htm) appears to have incorrectly included all vegetated wetlands in the “open water” loading category, so the findings presented here for total loading are appreciably different from the MEP analysis.
Subwatersheds
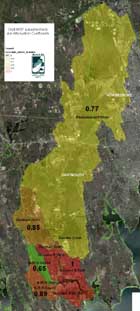
Draft MEP subwatershed delineations and transmission coefficients (= 1-attenuation)
Sewer and Septic Use
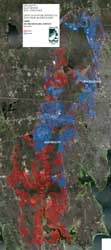
Click on wastewater service map for a larger image or open one of these files:
sewer-septic-slocums.pdf (2.5 MB pdf)
sewer-septic-slocums.kmz (2.7 MB Google Earth file)
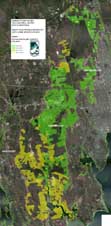
Click on water service map for larger image or open one of these files:
bbnep-water-service-slocums.pdf (2.5 MB pdf)
sewer-septic-slocums.kmz (2.7 MB Google Earth file)
Other Embayment Loading Estimates
Little River, Dartmouth
New Bedford Harbor
Slocums River, Dartmouth
Wareham River
We hope the information on this page will give municipal officials, planners, and residents the opportunity to review our GIS work and data and to help all to better understand any comments or analyses that we may convey to MA DEP or the US EPA. We also hope the information presented here will help convey a clear understanding of nitrogen loading characteristics for this watershed.
Evaluating watershed nitrogen loading is just one part of the process for establishing nitrogen TMDLs for impaired coastal waters. The Massachusetts DEP and EPA are setting these TMDLs based on studies being conducted by the Massachusetts Estuaries Project. More information about this effort can be found on the MEP Oceanscience.net site, UMass Dartmouth SMAST site, and this DEP TMDL page.
Watershed delineations
The watershed used for the analysis presented on this page is the subwatershed adopted by the Massachusetts Estuaries Project, and is based on land surface topography defining a bedrock valley watershed. Except for a few small areas, it is nearly identical to the watershed adopted by the Buzzards bay NEP in 1990, and was based on subwatershed delineations developed and refined by Mass DEP and USGS.
slocums_1shed_11jun10.zip (zipped shapefile)
slocums_1shed_11jun10.kmz (Google Earth file; requires Google Earth, a free software program, or comparable)
Subwatersheds and Attenuation
As of September 2010, the Massachusetts Estuaries Project used the subwatersheds with the net nitrogen transmission coefficients specified in the table below and map to the right.
| SUBW_ALT | SUBID | ACRES | NET_N |
| ESTUARY | 0 | 440 | 1.00 |
| Slocums R West | 5 | 635 | 1.00 |
| Slocums R East | 6 | 891 | 1.00 |
| Slocums R South | 10 | 543 | 1.00 |
| BJR S Gaged | 9 | 884 | 0.89 |
| BJR N Gaged | 7 | 533 | 0.65 |
| BJR N Ungaged | 8 | 38 | 0.65 |
| Destruct North (Gaged) | 3 | 1,857 | 0.85 |
| Destruct South (Ungaged) | 4 | 72 | 0.85 |
| Dundee Creek | 2 | 1,572 | 0.77 |
| Paskamansett River | 1 | 16,410 | 0.77 |
| Total | 23,867 |
slocums_sheds_11jun10.zip (zipped shapefile)
slocums_sheds_11jun10.kmz (Google Earth file)
Sewering and Septic Use
Properties in Dartmouth with sewer service are principally served by the Dartmouth wastewater facility, but a handful of sewered properties are connected to the New Bedford sewer mains. There was little expansion of sewer service in Dartmouth within the Slocums River watershed between 2005 and 2010.
| Year | parcels with wastewater | parcels with sewer | parcels with septic systems | buildings with wastewater* | number of septic systems** | units served by septic systems |
| 2005 | 6,030 | 4,226 | 1,794 | 6,266 | 1,828 | 1,922 |
| 2010 | 6,212 | 4,380 | 1,832 | 6,403 | 1,866 | 1,962 |
*This estimate includes structures with presumed wastewater service (sewer or septic) and does not include residential garages or other accessory commercial or residential structures. A two-family dwelling may consist of two units (condos or apartments) in one structure. **The number of septic systems may be slightly less than the number of buildings served by septic systems (not shown) because two buildings on one parcel may have been presumed to share a septic system. For any given watershed, the number of units, buildings, and septic systems are not equal. There are more “units” in a watershed than “buildings” because a building may have multiple residential or business units. For example, a two-family dwelling may consist of two units (condos or apartments) in one structure, but that one structure may be served by a single septic system. For septic system loading calculations, units is probably the best value to use of the three parameters.
Residential and Commercial Water Use
As of 2010, an estimated 828 properties in the watershed had well water and an estimated 5,464 had municipal water (labeled either “MUNICIPAL” in accompanying maps, or labeled “MUNICIPAL0” which had water accounts but no flows (30 parcels), or labeled “MUNICIPAL2” (145 properties), which were generally municipal properties without accounts, or were recently constructed structures where water account information was not identified).
| Table 1. Water Accounts broken down by sewer and septic users in the town of Dartmouth portion of Slocums River Watershed | ||||
| USE_CODE | # on SEPTIC | # on SEWER | SEPTIC GPD | SEWER GPD |
| 101 (single family) | 596 | 1563 | 172.1 | 167.5 |
| 104 (two-family) | 44 | 37 | 292.6 | 230.6 |
| 109 (multiple houses) | 6 | 13 | 266.1 | 236.1 |
| 325 (small retail) | 5 | 20 | 257.4 | 304.8 |
| 931 (municipal) | 4 | 1 | 57.4 | 41 |
| 962 (municipal) | 3 | 1 | 840.2 | 153.7 |
Wastewater Facility and Other Permitted Discharges
There are no groundwater wastewater facility discharges in this watershed that require a state permit (i.e. none greater than 10,000 gpd). There are no major NPDES discharges to surfaces waters in this estuary watershed. There are three existing or discontinued solid waste sites in the watershed including the Crapo Hill landfill and compost site (CO0072.008), closed, capped, but unlined Dartmouth disposal site at 976 Russells Mills Rd and existing composting site, the Sullivans Ledge superfund site, and the closed New Bedford Shawmut Avenue landfill which is also a US EPA superfund site (see EPA permit 110009289493). These should be reviewed for relevance in any nitrogen loading analysis.
Nitrogen Loading and Land Use
In many respects, conducting a watershed nitrogen loading analysis is little more than enumerating the number of houses with septic systems in a watershed, approximating their occupancy (and thus loading from those septic systems), accounting for any permitted point source discharges, and estimating the loadings of certain non-point sources of nitrogen, based on their areas, including agricultural land, impervious surface, water surface areas, and undeveloped land. Details of the methodologies used here is described on our Parcel Loading Analysis page.
Farm animal loads were taken directly from loading spreadsheet used for the published MEP report, as were these precipitation and recharge rates:
| Impervious Surfaces | ||
| Recharge rate from precipitation (off of impervious surfaces) | 40 | inches per year |
| N concentration of road runoff | 1.5 | milligrams per liter (ppm) |
| Assumed footprint for all buildings | 1500 | square feet |
| Assumed footprint for all driveways | 1500 | square feet |
| N concentration of roof runoff | 0.75 | milligrams per liter (ppm) |
| Water Bodies | ||
| Recharge rate from precipitation | 40 | inches per year |
| N concentration of precipitation | 1.09 | milligrams per liter (ppm) |
| Natural Areas | ||
| Recharge rate from precipitation for natural areas | 27.25 | inches per year |
| N concentration of recharge via natural areas | 0.072 | milligrams per liter (ppm) |
Key Land Use Features in Loading Analysis
| Subwatershed Landuse (values in acres unless specified) | SUB ID | Acres | freshwater acres | natural landscp acres | road acres | non-road imperv | pasture acres | cropland+ orchard acres | cranberry acres | golf courses | No. of Buildings (for lawns) | Sum of septic units |
| ESTUARY | 0 | 440 | 0 | 0 | 0 | 0 | 0 | 0 | 0 | 0 | 0 | 0 |
| Paskamansett River | 1 | 16,405 | 194 | 12,910 | 529 | 1,326 | 287 | 157 | 15 | 381 | 5,292 | 1,184 |
| Dundee Creek | 2 | 1,572 | 25 | 1,262 | 31 | 53 | 136 | 19 | 0 | 0 | 401 | 162 |
| Destruct North (Gauged) | 3 | 1,857 | 16 | 1,625 | 29 | 51 | 52 | 26 | 24 | 0 | 307 | 310 |
| Destruct South | 4 | 72 | 0 | 53 | 0 | 1 | 6 | 12 | 0 | 0 | 5 | 5 |
| Slocums R West (A) | 5 | 640 | 0 | 502 | 8 | 8 | 46 | 70 | 0 | 0 | 45 | 45 |
| Slocums R East (B) | 6 | 876 | 3 | 800 | 18 | 15 | 15 | 10 | 0 | 0 | 127 | 127 |
| BJR N Gaged | 7 | 533 | 0 | 476 | 2 | 4 | 5 | 44 | 0 | 0 | 16 | 16 |
| BJR N Ungaged | 8 | 39 | 0 | 25 | 2 | 1 | 1 | 10 | 0 | 0 | 5 | 5 |
| BJR S Gaged | 9 | 884 | 1 | 749 | 8 | 13 | 67 | 39 | 0 | 0 | 59 | 59 |
| Slocums R South (C) | 10 | 550 | 2 | 468 | 5 | 2 | 37 | 36 | 0 | 0 | 9 | 9 |
| Grand Total | 23,867 | 241 | 18,869 | 632 | 1,473 | 652 | 422 | 39 | 381 | 6,266 | 1,922 |
Attenuated Nitrogen Loading
| Attenuated Subwatershed Loading (lbs) | SUB ID | precip on natural surface | precip to water and BVW | imperv precip runoff | golf courses | agricult. fertilizer | lawn fertilizer | septic systems | Farm Animals | attenuated total | % of total |
| ESTUARY | 0 | 0 | 4,569 | 0 | 0 | 0 | 0 | 0 | 0 | 4,569 | 4.1% |
| Paskamansett River | 1 | 4,473 | 33,115 | 14,749 | 6,988 | 2,324 | 2,198 | 11,287 | 3,445 | 78,580 | 71.1% |
| Dundee Creek | 2 | 437 | 2,345 | 685 | 0 | 602 | 167 | 1,544 | 8 | 5,789 | 5.2% |
| Destruct North | 3 | 621 | 3,004 | 720 | 0 | 804 | 141 | 3,262 | 236 | 8,788 | 8.0% |
| Destruct South | 4 | 20 | 52 | 6 | 0 | 116 | 2 | 53 | 0 | 248 | 0.2% |
| Slocums R West (A) | 5 | 226 | 569 | 173 | 0 | 845 | 24 | 557 | 0 | 2,395 | 2.2% |
| Slocums R East (B) | 6 | 360 | 1,615 | 362 | 0 | 161 | 69 | 1,572 | 0 | 4,138 | 3.7% |
| BJR N Gaged | 7 | 139 | 271 | 36 | 0 | 277 | 6 | 129 | 0 | 857 | 0.8% |
| BJR N Ungaged | 8 | 7 | 28 | 19 | 0 | 59 | 2 | 40 | 0 | 155 | 0.1% |
| BJR S Gaged | 9 | 300 | 1,026 | 200 | 0 | 581 | 28 | 650 | 0 | 2,785 | 2.5% |
| Slocums R South (C) | 10 | 210 | 1,300 | 77 | 0 | 488 | 5 | 111 | 0 | 2,192 | 2.0% |
| Grand Total (lbs) | 6,795 | 47,894 | 17,028 | 6,988 | 6,256 | 2,641 | 19,206 | 3,690 | 110,497 | 100.0% | |
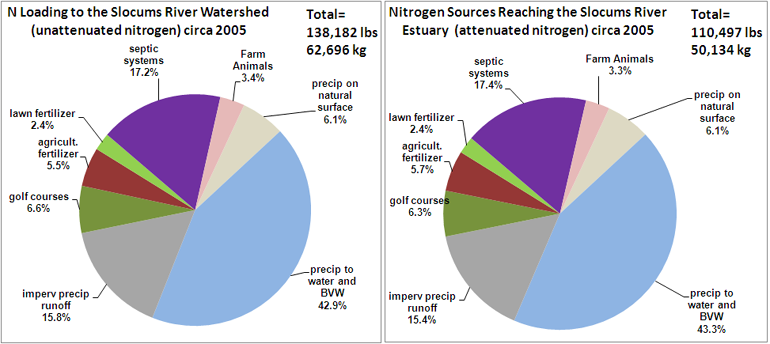
| percent of total | 6.1% | 43.3% | 15.4% | 6.3% | 5.7% | 2.4% | 17.4% | 3.3% | 100.0% |
The pie charts below show unattenuated loads to the watershed and attenuated loads to the estuary, based on 2005 conditions. For septic loading, a water use of 172.1 gpd (x 90% to adjust for non-wastewater use as per MEP methodology) was used in the calculation. The role of runoff in this watershed is so large because the mid and upper portions of the watershed are so urbanized. These pie charts however have the extensive vegetated wetlands in this watershed assigned the same loading as natural landscapes, which is the typical approach adopted by the MEP, but was not the method adopted in the MEP’s Slocums River report as described below.
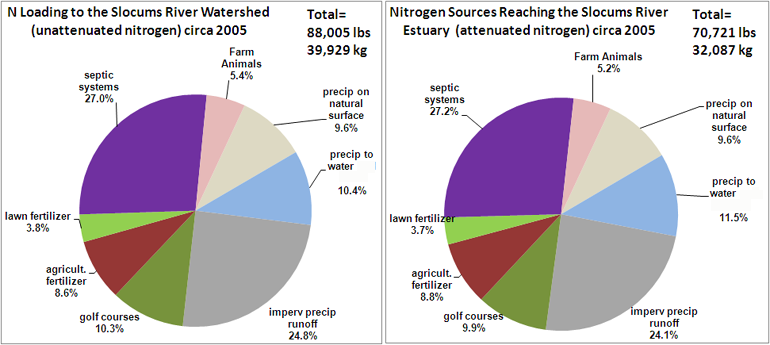
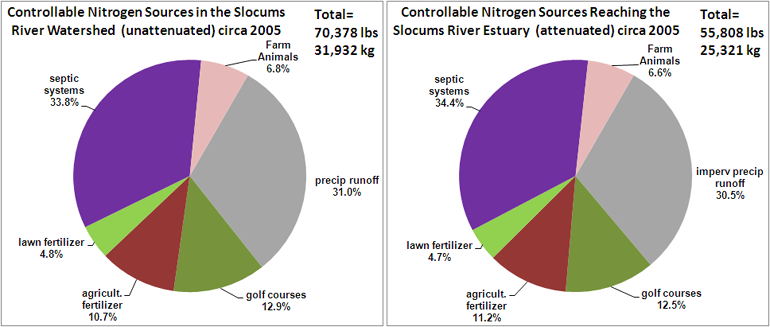
These pie charts below have vegetated wetlands assigned the same loading as “open water” (9.6 lbs per acre), as was intentionally been done in MEP’s Slocum River TMDL report (compare them to the MEP pie charts at the bottom of this page). This loading rate to vegetated wetlands is higher than roof loading, and because it forested wetlands cover thousands of acres in this watershed, it diminishes the significance of other sources. These pie charts to better contrast the differences in the role of impervious cover as compared to the pie charts above and are consistent with the MEP’s adoption of treating vegetated wetlands the same as open water in terms of nitrogen loading.
For the controllable loads, these pie charts below show watershed loadings (unattenuated nitrogen) and estuary loadings (attenuated nitrogen).
Comparison of data to the MEP report
We compared the analysis presented for circa 2005 conditions) to the MEP’s 2008 report posted on the MEP website at the link at the bottom of the page. In the BBNEP’s analysis, 6,266 units with wastewater were estimated of which 1,922 units were presumed to be on septic systems. This is in general agreement with the MEP analysis, which identified 6,124 units, of which 2,089 systems were estimated to be on septic systems. The differences in the two estimates is due to the fact that in 2010 the BBNEP work with Dartmouth town officials to better define streets and properties actually connected to the Dartmouth sewer network (circa 2005 and present). The BBNEP used a water use of 172.1 GPD per septic system based on water department records for properties in the watershed. The MEP used a value 188 based on a preliminary town-wide estimate in 2008. The lower water use value used here further lowered the relative contribution of septic systems. With respect to lawns, the BBNEP analysis used 719 acres versus 615 acres used by the MEP.
The biggest discrepancy of this analysis with that conducted by the MEP is the fact that the BBNEP’s “water body” loading includes the salt water estuary area (440 acres) and freshwater pond acres (241 acres), whereas the MEP analysis included these, plus more than 5,500 acres of vegetated wetlands. This accounts for the tremendously high nitrogen loading in the “water bodies” category in the MEP analysis. The removal of vegetated wetlands from the natural landscape an into the “open water” category adds more than 52,000 lbs per year to the watershed loading, increasing unattenuated loading by 57%.
This intentional addition of vegetated wetlands into the water body surface area loading calculation was made by the MEP to address the unexpectedly high nitrogen concentrations observed tin the Paskamanset River which were not predicted by the usual MEP watershed loading model. There is considerable discussion of this problem in the report, and based on a number of observations the MEP concluded:
“In the Slocums River watershed exist extensive wetland and swamp lands surrounding most of the streams and rivers feeding into the estuary (Figure IV-5). Based on nitrogen species and loading information collected at the gauges to the Paskamanset River, Destruction Brook, BJR North and BJR South, it is clear that these wetlands are nearly saturated with nitrogen and are exporting nearly the same nitrogen loads as are being added to them by precipitation. This is equivalent to how surface waters act and how they are incorporated into the watershed nitrogen loading model. Because of this, MEP staff digitized these wetland areas using GIS techniques and treated these areas as surface waters for the purposes of developing their nitrogen loads in the Slocum River watershed nitrogen loading model. A total of 5,511 acres of this type of wetland exists in the Slocum River watershed; no wetlands of this type were assigned in the Little River watershed.”
The second largest difference between the BBNEP analyses presented here is the area of impervious surface areas used to estimate stormwater loading. While the MEP did directly digitize some areas such as Dartmouth mall buildings and parking, and similar surfaces at UMass Dartmouth, for the most part, they assumed 1500 square feet of roof and parking per unit, including commercial properties. This resulted in an estimated 1,351 acres of impervious total, whereas the BBNEP, using the MassGIS impervious surface coverage presented here estimated, 2,104 acres. Even if the MEP had included this higher impervious surface area, it would not have fully explained the higher nitrogen concentrations observed in the river.
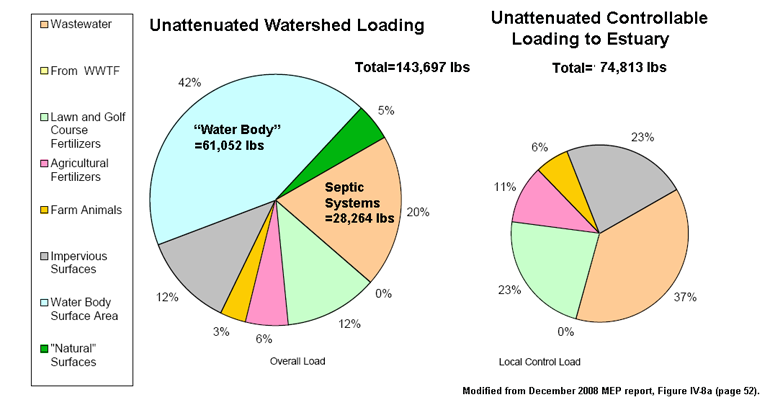
Pie Chart from 2008 MEP report (modified with labels added). Click to enlarge.
Sensitivity Analyses
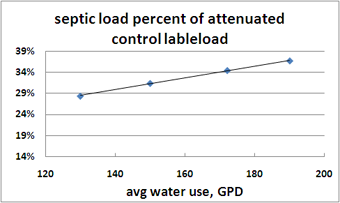
The septic loading used for this watershed analysis is higher than the averages used by the MEP in most other studies (172.1 gpd residential water use), but is actually slightly lower than the value used in the published 2008 MEP report (188 gpd). The figure below shows how total septic loading changes with water use.
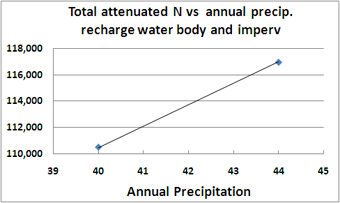
For most subwatersheds on Cape Cod, the MEP assumed that stormwater recharge from impervious surfaces and water bodies was 40 inches per year (=90% of an annual total precipitation of 44.4 inches). This is the value the MEP used in the Slocums River report. However, annual precipitation increases by several inches moving west away from Cape Cod, and for the New Bedford TMDL report, the MEP used an annual precipitation of 47.8 inches, with a 90% recharge, for a net recharge rate of 43 inches for impervious surfaces.
Embayment area, bathymetry, and tidal range
This data was developed in the 1990s by the Buzzards Bay NEP.
| Embayment | Water area km2 | mean depth at MLW (m) | mean depth (m) at Half Tide | Vol. at MLW m3x10^6 | Vol. at Half Tide m3x10^6 | Tidal Range(m) |
| Slocums River | 1.97 | 0.74 | 1.29 | 1.45 | 2.53 | 1.1 |
BBNEP GIS Data and Loading Spreadsheet
Parcels (joined to assessors, sewer account, and water account data): slocum_parc09_bbp_17dec2010.zip
BBNEP December 2009 protected open space coverage: bbnep_openspace_dec09.zip (factored into the parcel coverage with some modifications).
Wareham River watershed: slocums_1shed_11jun10.zip
Subwatersheds: slocums_sheds_11jun10.zip (includes draft attenuation coefficients)
EOT Road Impervious: eotroads09_slocums_p.shp.zip
Parcel Impervious: imprv_slocums_parc_only_28jun10.zip
MassGIS 2005 Landuse: landuse_2005_slocums_diss_oct2010.zip (used by the BBNEP to calculate golf, and agriculture, except cranberry bogs)
Cranberry Bog Coverage 1: cranberry_bogs_coverage1.zip a simplified SE Mass cranberry bog growing area coverage
BBNEP Cranberry Bog Coverage: cranberry_bogs_semass_ac.zip a simplified SE Mass cranberry bog growing area coverage derived from DEP’s MassGIS WCP coverage.
Please review this loading spreadsheet that was used for this webpage: bbnep_nload_slocums_29dec2010.xlsx
Links to more information
In December 2008, the Massachusetts Estuaries Project posted the DEP approved report for the Slocums and Little River at:http://www.oceanscience.net/estuaries/Slocums-Little.htm (report downloaded 28 Dec 2010).
Buzzards Bay Coalition: Interactive WQ Maps
Buzzards Bay Coalition: Wastewater Driving Slocums River WQ declines
Buzzards Bay Coalition Slocums River Water Quality Trends, 1993-2003
Buzzards Bay Coalition Baywatchers III poster
Buzzards Bay Coalition Baywatchers 1992-2005 Water Quality Atlas
Buzzards Bay Coalition Westport-Dartmouth Lands Campaign
Buzzards Bay landfill sites 2007 DEP MassGIS data as a Google Earth File; click on polygon for more info
Please report errors or send comments about this page to Joe Costa.