History of the Buzzards Bay NEP’s Nitrogen Management Strategy
In 1990, the Buzzards Bay NEP, a participant in the U.S. Environmental Protection Agency’s National Estuary Program, developed a Total Maximum Daily Loads (TMDLs1) strategy to manage anthropogenic nitrogen inputs to coastal embayments in Buzzards Bay. This strategy was contained in the 1991 Buzzards Bay Comprehensive Conservation and Management Plan. The proposed approach was based on relating empirical information about water quality and living resources (like eelgrass) to different measures of nitrogen loading. While the 1991 CCMP recognized that embayment-specific models were desirable for setting nitrogen loading limits, these were viewed as too expensive and difficult to apply to 30 Buzzards Bay embayments in a timely way. The Buzzards Bay NEP’s methodology provided a quick yardstick to measure watershed loadings and establish watershed limits. One of its most important drawbacks was that it was a generalized approach that did not accommodate the loading pathways and hydrological features of each embayment. In the 1991 CCMP, the BBNEP recommended the use parcel data to calculate loading for embayments, and the BBNEP did this for the Buttermilk Bay overlay district in 1991, but GIS parcel coverages were not readily available in the 1990s, so most of the Buzzards Bay NEP’s initial watershed analyses and planning documents were based on an evaluation of MassGIS land use data.
In 1992, the Buzzards Bay NEP established, in partnership with the citizens group the Buzzards Bay Coalition, a water quality monitoring program to evaluate nitrogen loading impacts in Buzzards Bay. The purpose of this monitoring program was to not only document water quality conditions and trends in Buzzards Bay embayments, but to also evaluate the appropriateness of the specific nitrogen loading limits recommended in the 1991 CCMP. The data also proved useful in building public support for nitrogen action. This program continues to this day.
The data collected in this citizen-based water quality monitoring program has proved useful to both managers and the public and has prompted action to manage both point and non-point pollution sources alike. However, it was not until the late 1990s that the BBNEP used the data to revise the original CCMP loading limit recommendations. The 1999 report below represents that undertaking. While the data in the report supports the fundamentals of the Buzzards Bay NEP’s management approach such as calculating mass loadings to land, and tailoring TMDLs to bay volume and flushing, it also suggested that the recommended limits are too high, and in some cases need to be reduced by one half.
About 2001, the Buzzards Bay NEP’s methodology for establishing nitrogen loading limits was superseded by the DEP’s Massachusetts Estuaries Project (MEP) model. This new approach identified threshold loading targets based on a similar nitrogen loading approach, but where existing water quality was compared to loading and a predictive water quality model. This improved approach was what was originally envisioned in the original CCMP, and the BBNEP fully supports the efforts of the MEP program.
When the MEP established, its goal was to develop TMDLs for 89 embayments in Massachusetts. Originally this work was scheduled to be complete by 2010, but delays in completion of studies and budget shortfalls have slowed progress on the effort.
The MEP’s nitrogen loading methodologies are quite similar to that used by the BBNEP and Cape Cod Commission in the 1990s and all the models use similar assumptions, although the MEP updated a number of loading coefficients based on new studies and information. In the 1990s, the Buzzards Bay NEP’s GIS spreadsheets used certain MassGIS land use areas in its loading analyses, with residential units calculated from US Census GIS coverage, parcel data, or other information as desired. The MEP’s parcel loading spreadsheets are more comprehensive in that every Assessor’s office parcel area is assigned an area for impervious, lawn, natural landscapes, and so forth. These areas are multiplied times loading coefficients. The BBNEP recommends that towns and their consultants adopt this modeling approach to ensure consistency with the MEP model when evaluating various management options to achieve EPA approved TMDLs.
Because most watershed nitrogen loads are dominated by septic systems, the most important element of any nitrogen loading model is to correctly estimate the number of septic systems in the watershed, and beyond that, estimating the number of individuals using those septic systems. The Buzzards Bay NEP’s approach was simply to assume per capita wastewater discharge to groundwater was 2.7 kg (5.94 lb). To calculate annual loadings the BBNEP would then use US census statistics and GIS coverages to get average occupancy for the watershed being studied. One disadvantage of this process was that it failed to capture high summer seasonal use which occurred in some Cape Cod coastal areas.
The MEP took a very different approach to the problem by examining annual water use based on municipal water records. The advantage of this process is that it better captured seasonal increased occupancy. A disadvantage of this approach is that it was confounded by the fact that water use during the summer may double at any particular residence because of lawn and garden irrigation, and consumption for filling pools. However, there are statistical approaches for addressing outliers in a data set.
Another issue that arises with water use data is that an assumed wastewater concentration must be adopted. Actual septic system loading is calculated by flow times concentration. In reviewing household wastewater studies, the BBNEP recognized that wastewater nitrogen concentrations from residences with similar occupancies can vary dramatically with water use. That is to say, wastewater nitrogen concentrations will be much higher in homes constructed with low flow devices (toilets and showers) or where water conservation is practiced.
The BBNEP adopted an annual per capita loading rate of 2.7 kg or 5.95 lbs, based on a 1990s review of studies of human waste and wastewater. The value adopted was also comparable to the assumed 35 ppm and 55 gpd per capita discharge assumed by the Cape Cod Commission in their loading models in the 1990s. Today, per capita water use discharge to septic systems is generally assumed to be less than 55 gpd and groundwater effluent concentrations can be higher than 35 ppm. In the MEP published reports, wastewater concentrations are assumed much lower (26.25 ppm based on various new studies, including studies at the Massachusetts Septic System Test Center). In MEP reports, for comparisons, this concentration is multiplied times 55 gpd for an implied typical per capita load of 4.4 lbs (2.0 kg) per person. However, in practical terms, the MEP residential wastewater unit often ranges from 140 to 180 gpd which for some watersheds implies 70 to 80 gallons per day per capita water use depending on how occupancy is calculated, which results in loadings closer to those formerly used by the BBNEP. Additional nuances of these calculations can be found on our water use and occupancy page.
BBNEP 2000 Proposed Water Quality Standards
In 1999 and 2000, the Buzzards Bay NEP proposed the water quality standards in the table below to DEP (see 1999 and 2000 papers below) based on best professional judgment. These standards were proposed as surrogate measures of nitrogen loading, corresponding to the proposed TMALs for nitrogen identified for waters designated ORW, SA, and SB categories as proposed in our original nitrogen strategy. The table was developed empirically based on the correlations between loadings and water quality response shown in the figures in the 2000 paper. Thus they represent the lowest value possible before dropping into the next lower category of “good” “fair” and “poor.” In this sense they are not necessarily the ideal value for that category. The ideal goals for Buzzards Bay embayment water quality remain closer to the Eutrophication Index values shown in the table. All these values are based on mean summertime concentrations when critical conditions are most likely to occur. See Costa et al. (1999) for definition of eelgrass to habitat ratio.
In the end, DEP and the Massachusetts Estuaries Project adopted a similar approach to establish TMDLs for Massachusetts embayments, but instead of using the simplified tiered strategy proposed by the BBNEP in the early 1990s, new, more sophisticated embayment-specific modeling methods that had become available are now being used that incorporate flushing, loading, and other factors that defines each embayments response to nitrogen loading and specific target total nitrogen and chlorophyll concentration, and eelgrass cover goals goals.

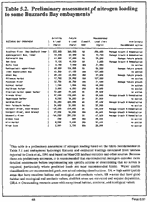
1991 Preliminary nitrogen loading recommended limits for Buzzards Bay embayments (click on image).
Original BBNEP Nitrogen Management Documents
This page provides some links to sub-pages that relate to the original formulation of the Buzzards Bay NEP strategy in the 1990s. The original justification of the approach is laid out in our nitrogen management action plan adopted in 1991 and finalized in 1992. We provide these links and correspondence to provide a historical context of current efforts to manage nitrogen in Buzzards Bay.
1990 letter to DEP on Marion sewage treatment facility.
1993 letter to DEP on need for statewide nitrogen approach.
1993 helping establish 4 bedroom per acre Title 5 limit for Zone 2s.
1993 letter to DEP supporting proposed revisions to Title 5.
1994 report on using MassGIS land use data to calculate nitrogen loading.
1999 report: Managing anthropogenic nitrogen inputs to coastal embayments. 1.2 MB
Originally, this document was to be submitted to a scientific journal, but because it was too long and unwieldy, it remained an internal technical report used to help refine nitrogen management strategies in the Commonwealth. Within two years it was superseded by the modeling approach adopted by the DEP Massachusetts Estuaries project.
September 1999 Nitrogen Management strategy revisions.
October 1999 Letter to municipal officials on proposed changes
October 1999 fact sheet on proposed new TMALs
January 2000 report: Supplementary supporting information on proposed new nitrogen TMALs.
Calculate a bay’s Nitrogen TMAL with this Excel spreadsheet.
This work was supported by a grant from the United States Environmental Protection Agency, Buzzards Bay Project:
Valiela, I. & Costa, J. E.. 1988. Eutrophication of Buttermilk Bay, a Cape Cod coastal embayment: Concentrations of nutrients and watershed nutrient budgets. Environmental Management 12: 539-553.

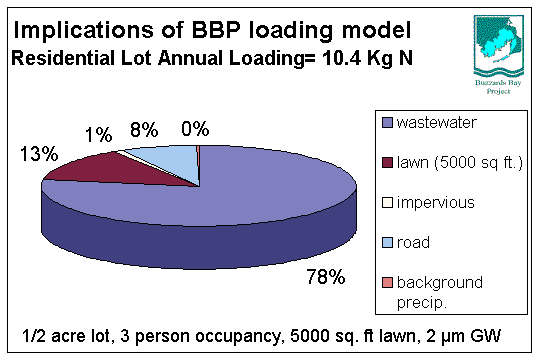
Nitrogen loading pie chart, residential development, old BBNEP Model, rounding to nearest percent.

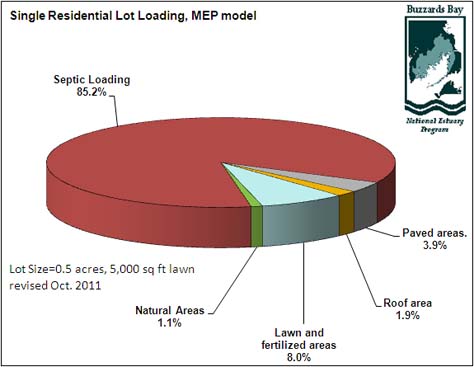
Nitrogen loading pie chart, residential development, MEP Model, rounding to nearest percent.
Updated Nitrogen Loading Spreadsheets
While these spreadsheets were developed in the 1990s, they are still applicable today because the fundamental approaches for estimating watershed nitrogen loads has not changed appreciably, and because these spreadsheets have been updated to be consistent with Massachusetts Estuaries Project loadings assumptions. The exception to this is our estimated septic loading, which are based on assumed average annual occupancy, whereas the MEP gathers water use records for each residence based on town water records (when available).
Buzzards Bay sub-basin land use statistics and embayment areas (Excel file)
Calculate your own Eutrophication Index with this Excel spreadsheet
Excel Spreadsheet “Subdivision.xls”: Calculate nitrogen loading from a subdivision with this spreadsheet
(right click to save to your hard disk)
Buzzards Bay watershed and subbasin lines used by the BBNEP
Buzzards Bay watershed major basin boundary Study Area (2009 update). (zipped GIS shape file)
2009 updated Buzzards Bay watershed sub-basin boundaries. (zipped GIS shape file).
Original Buzzards Bay sub-basin boundaries. (zipped GIS shape file)
These are the basin and sub-basin coverages employed by the Buzzards Bay NEP. They differ from the MassGIS data layer in that it includes Cape Cod, and because the area of towns of Plymouth, Wareham, and Bourne is based on groundwater elevations (appropriate for glacial outwash and moraines), and not land use topography. The Cape Cod sub-basins are identical to those adopted by the Cape Cod Commission, but with some additional subdivided areas. The northern watershed boundary is based on groundwater contours, and was developed in partnership with the USGS, and adopted by the Buzzards Bay NEP in 1991. It differs from the MassGIS boundary for the Buzzards Bay watershed which is based on land surface topography, and which does not include Cape Cod. It was modified in the late 1990s based on Cape Cod Commission redelineation of watersheds. This version was last adjusted in 2006 based on Massachusetts Estuaries Project data for Cape Cod, reassessment of areas in Westport and Rochester, and other information. The “HN” coverage represents a presumed “high nitrogen contribution zone.” More information about these coverages can be found on our Buzzards Bay watershed boundary page.
Notes
(1) We actually called ours TMALs because they were based on annual loading assumptions. Federal regulations and guidelines allow TMDLs to be expressed in any unit of time appropriate to the pollution source to be managed.